Get insights into your Business Central data with Power BI
A data visualisation system from Microsoft
It's easy to get insights into your Business Central data with Power BI.
Power BI retrieves Business Central data so that you can build dashboards and reports based on that data. Power BI provides a flexible alternative to reports built in Business Central, enabling you drill down and customize the visualization, and even merge data from different companies in Business Central.
The sample reports below are available free to use*, ready to connect to your Business Central data in a matter of minutes.
*Require Power BI Pro License
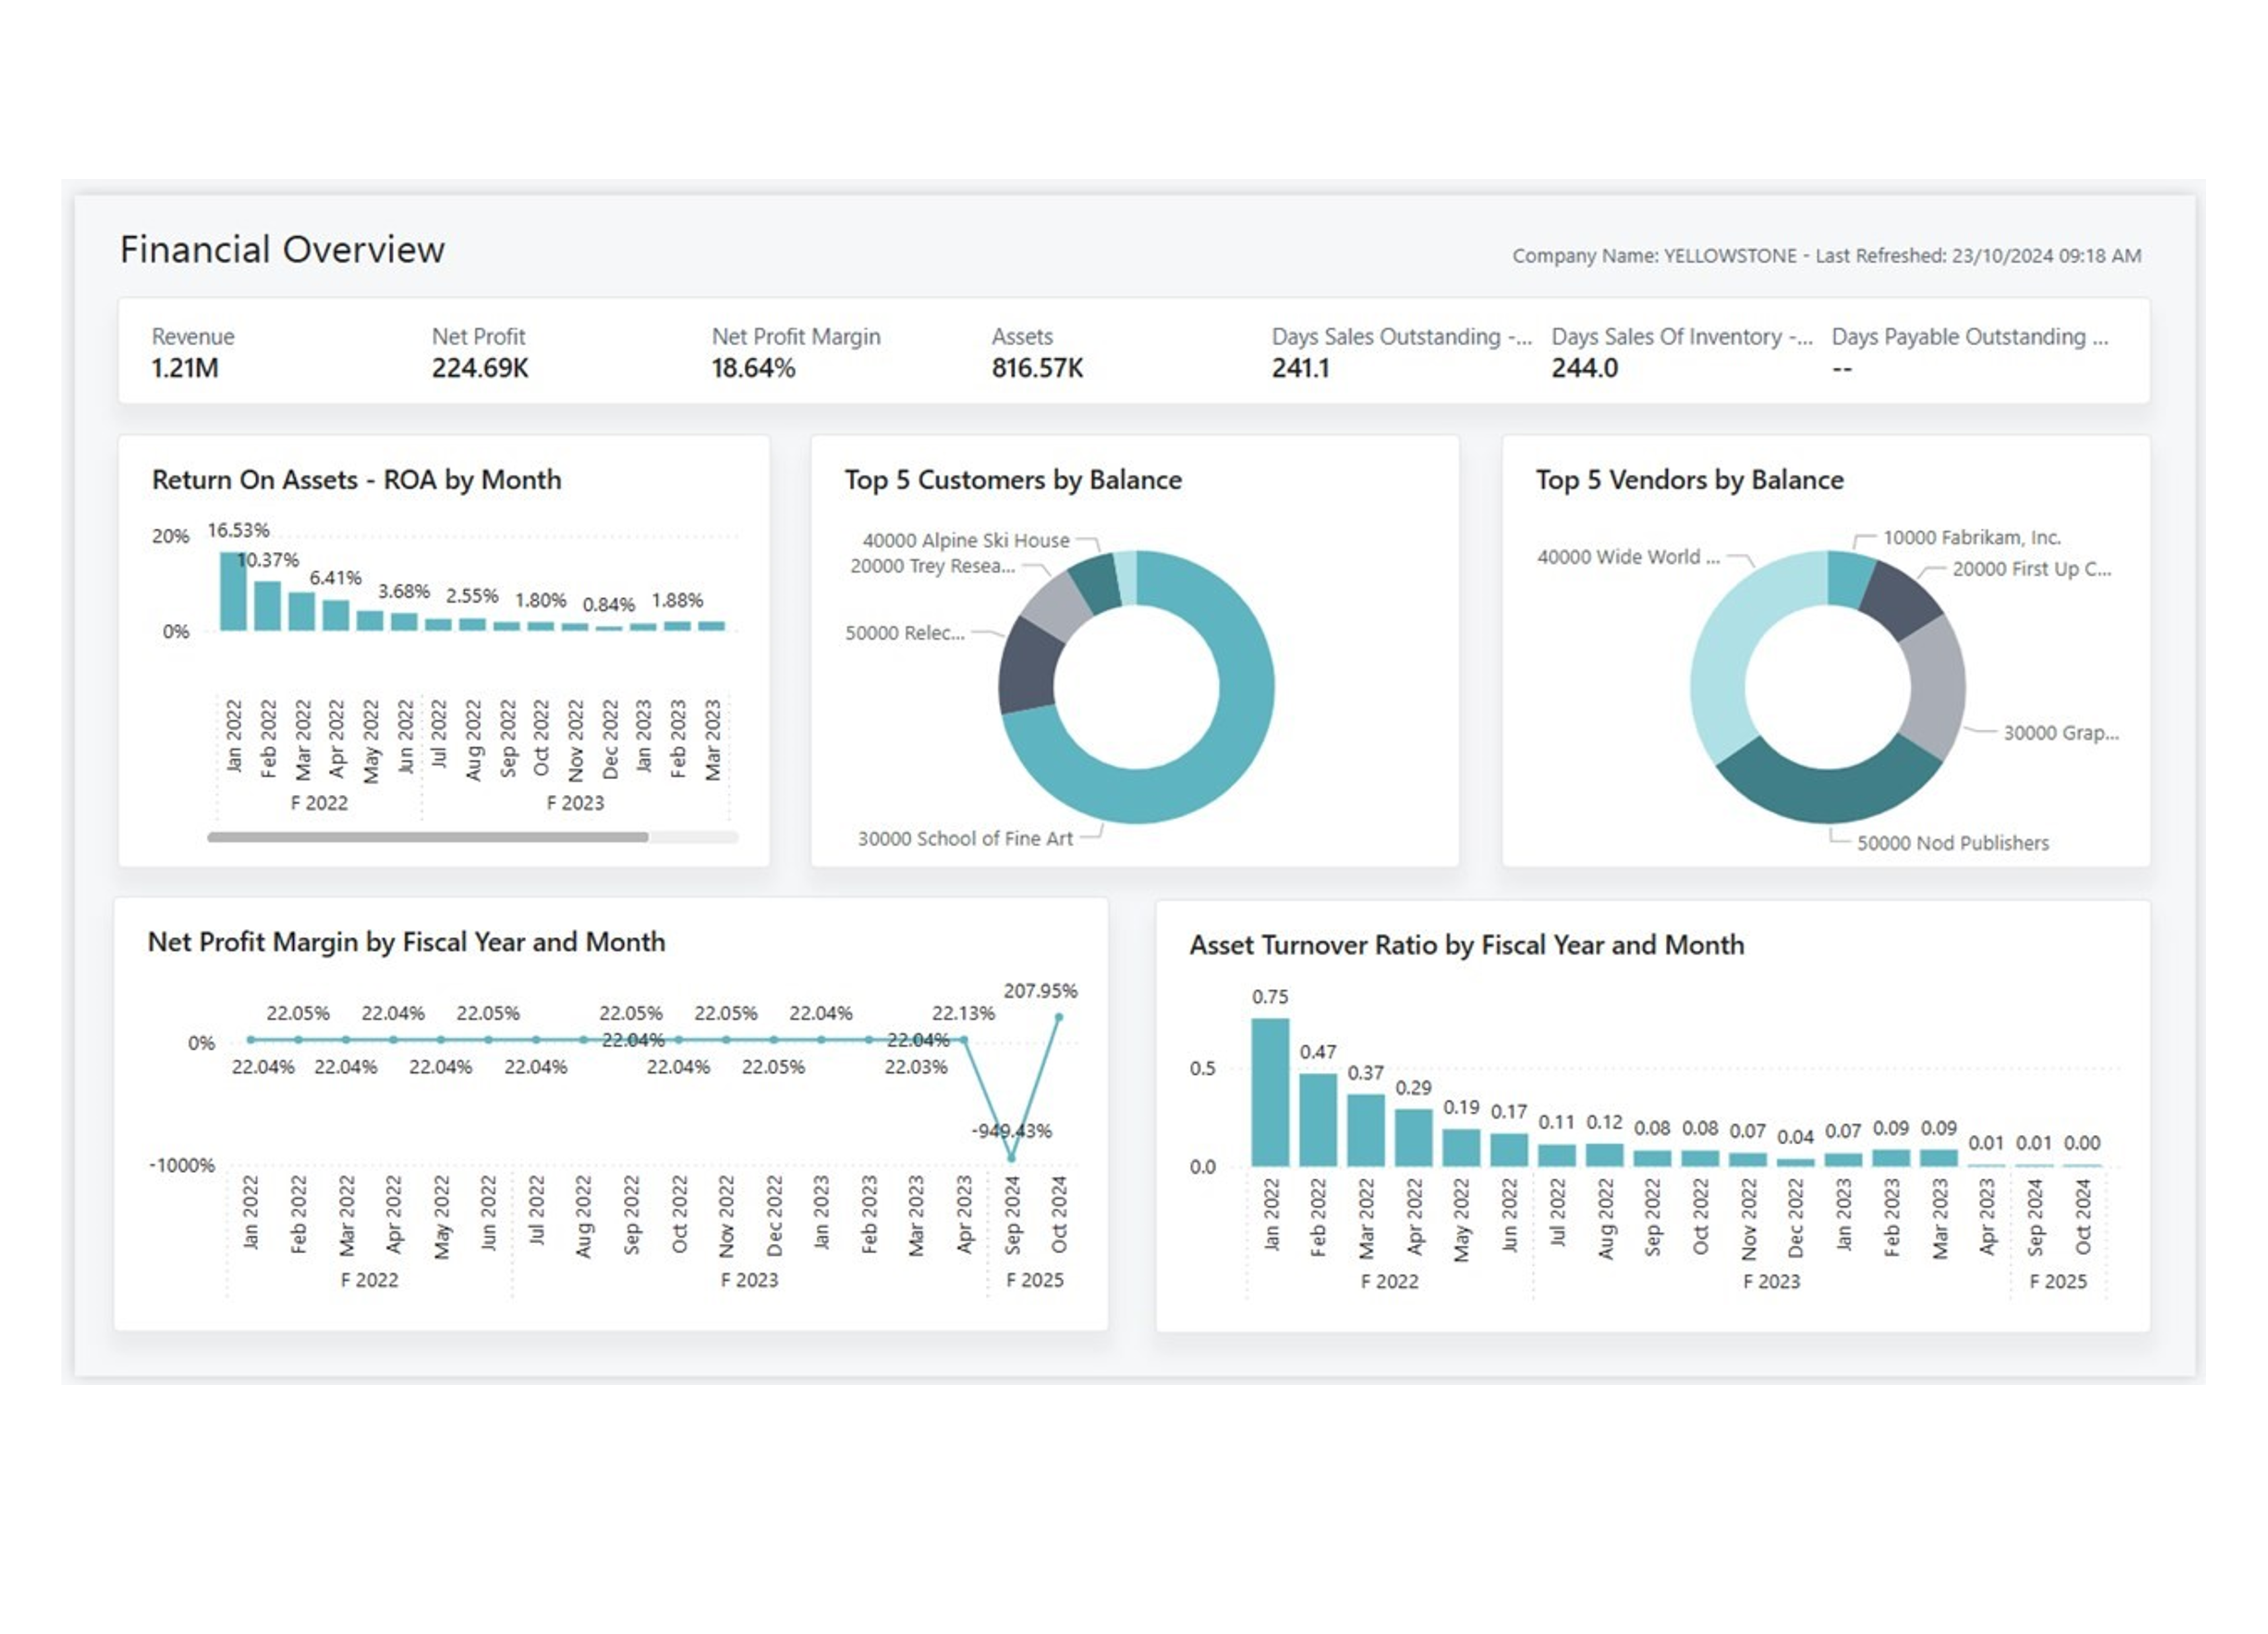
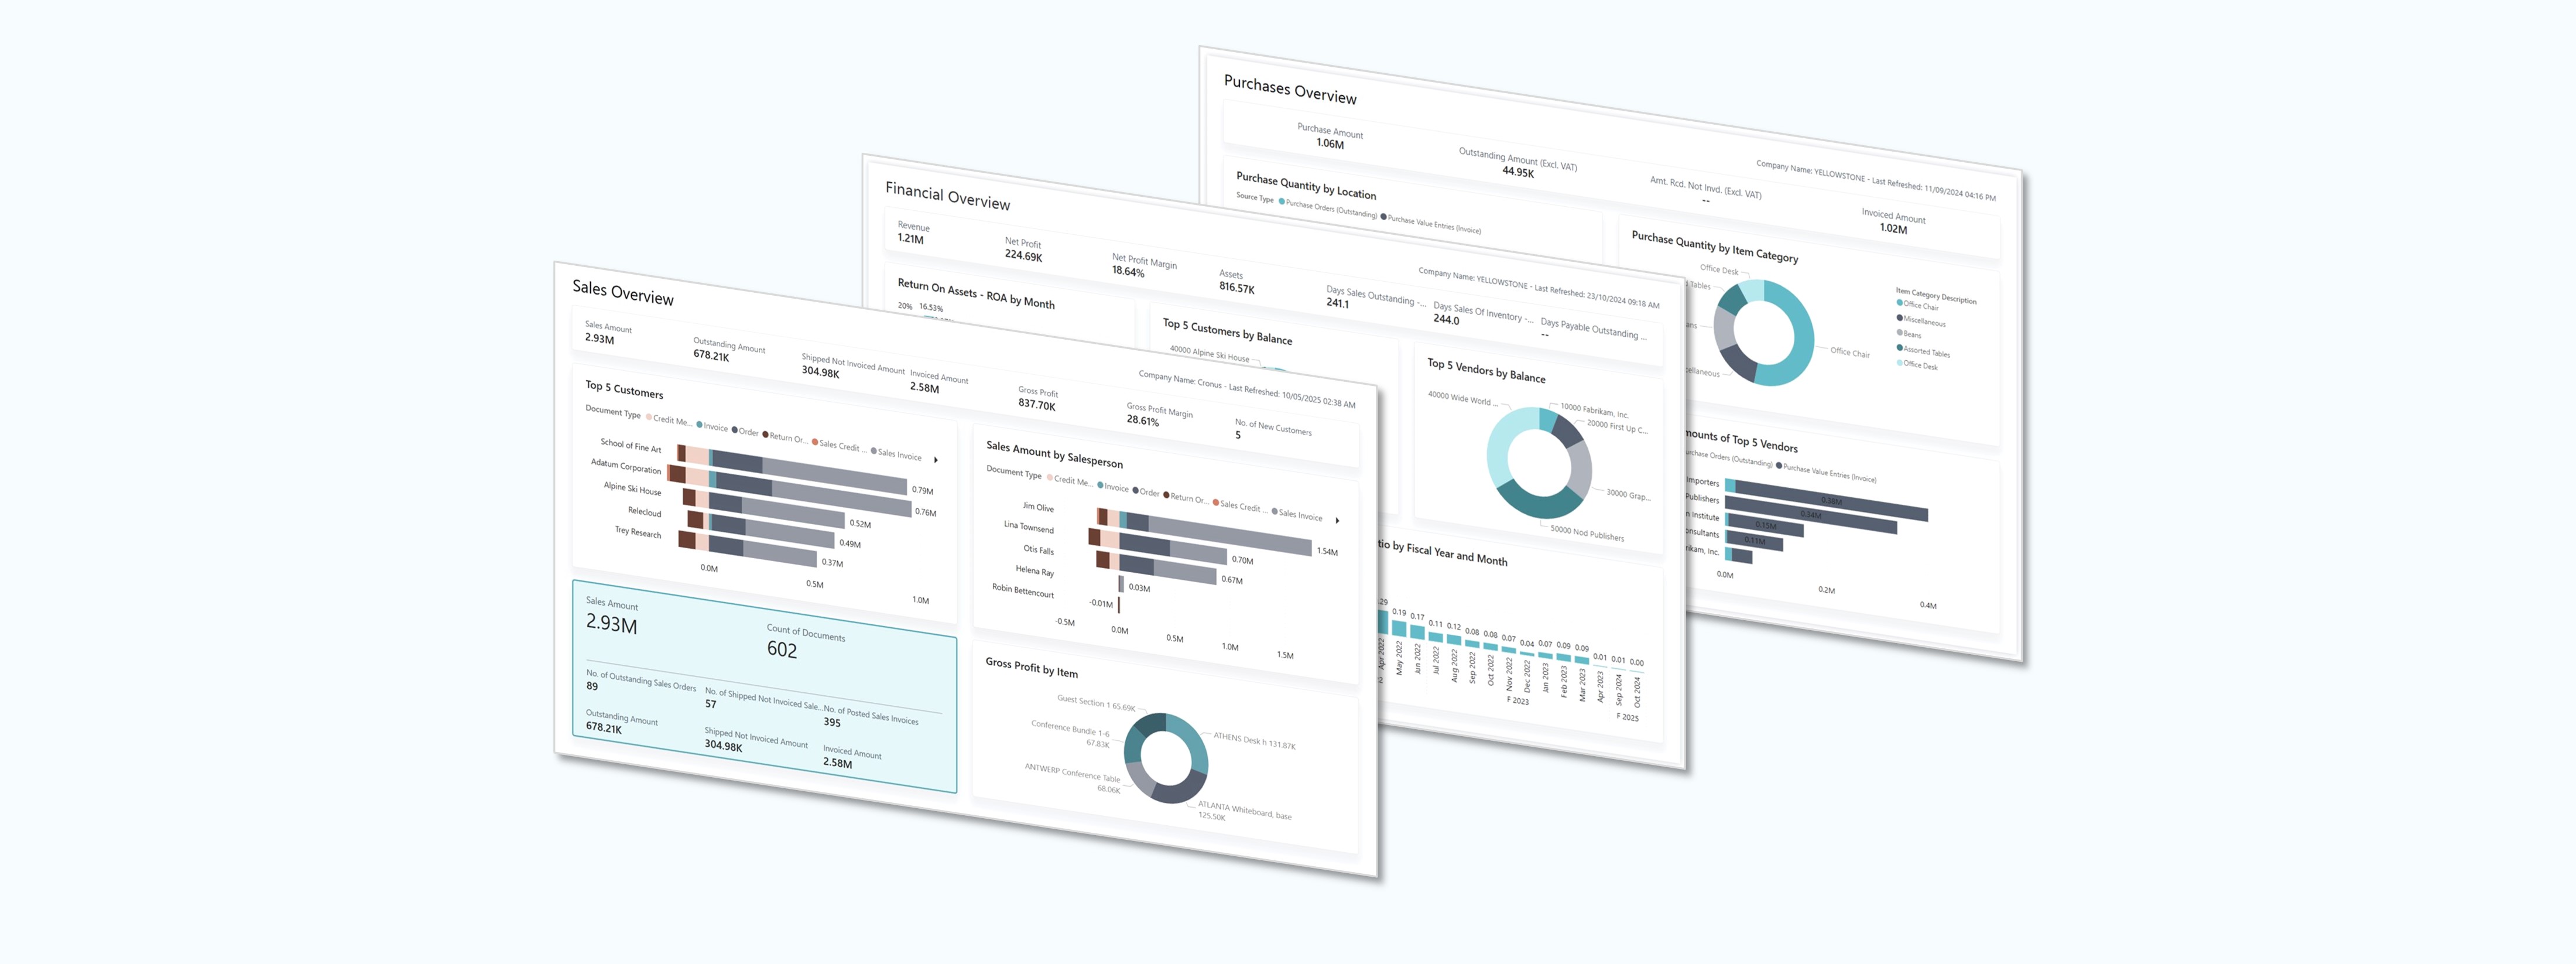
Finance Power BI App
Executives and the leadership team consume the data through high-level dashboards that present key performance indicators (KPIs) for finance. The KPIs aggregate data to provide a clear and concise overview of overall financial health, and highlight important performance metrics. This approach helps business leaders quickly assess performance toward strategic goals and make informed decisions without getting lost in granular details.
Managers and team leaders engage with the data through detailed managerial reports that showcase trends and summaries. Data is aggregated over time to reveal patterns and highlight areas that need attention. These reports provide context through charts, visualizations, and comparisons that help you understand underlying trends, identify risks, and make data-driven tactical adjustments.
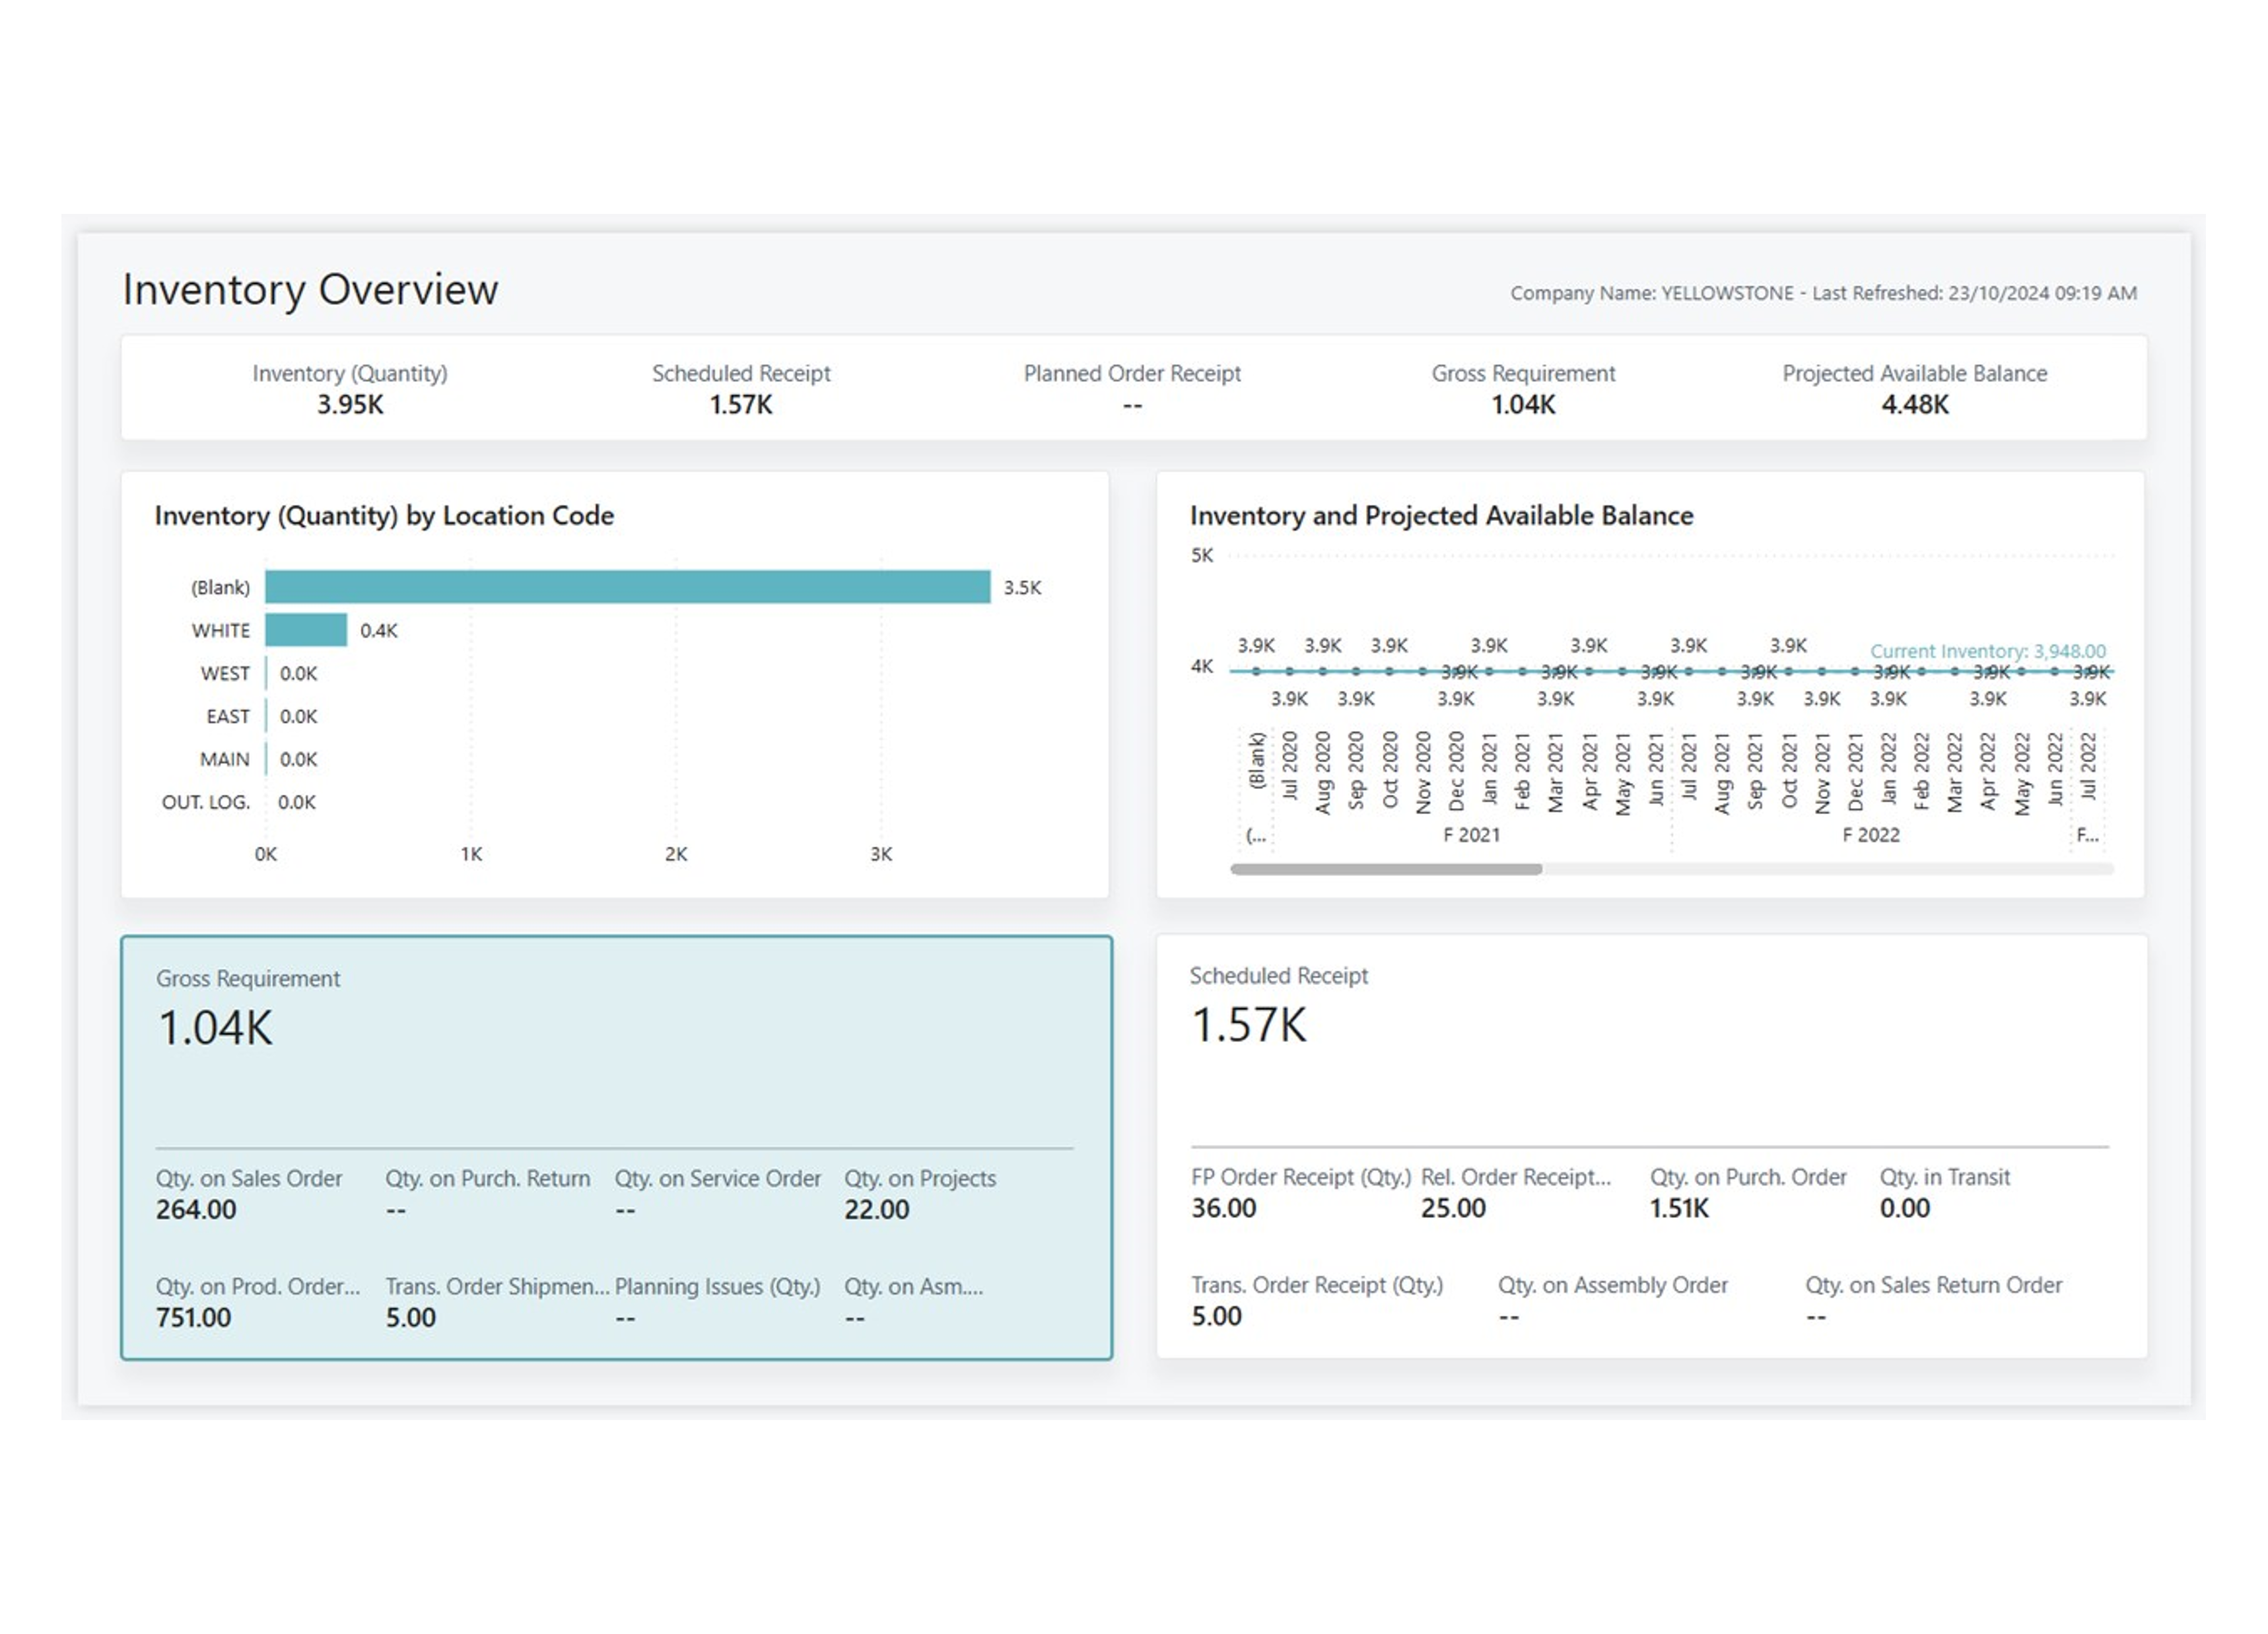
Inventory Power BI App
The Power BI Inventory app is designed to pull data directly from Business Central to give leadership, managers, and warehouse staff key information about inventory.
This app has various reports that offer insights into business operations. Use the information from these reports to make informed decisions that ensure you meet demand, keep costs low, and don't delay production.
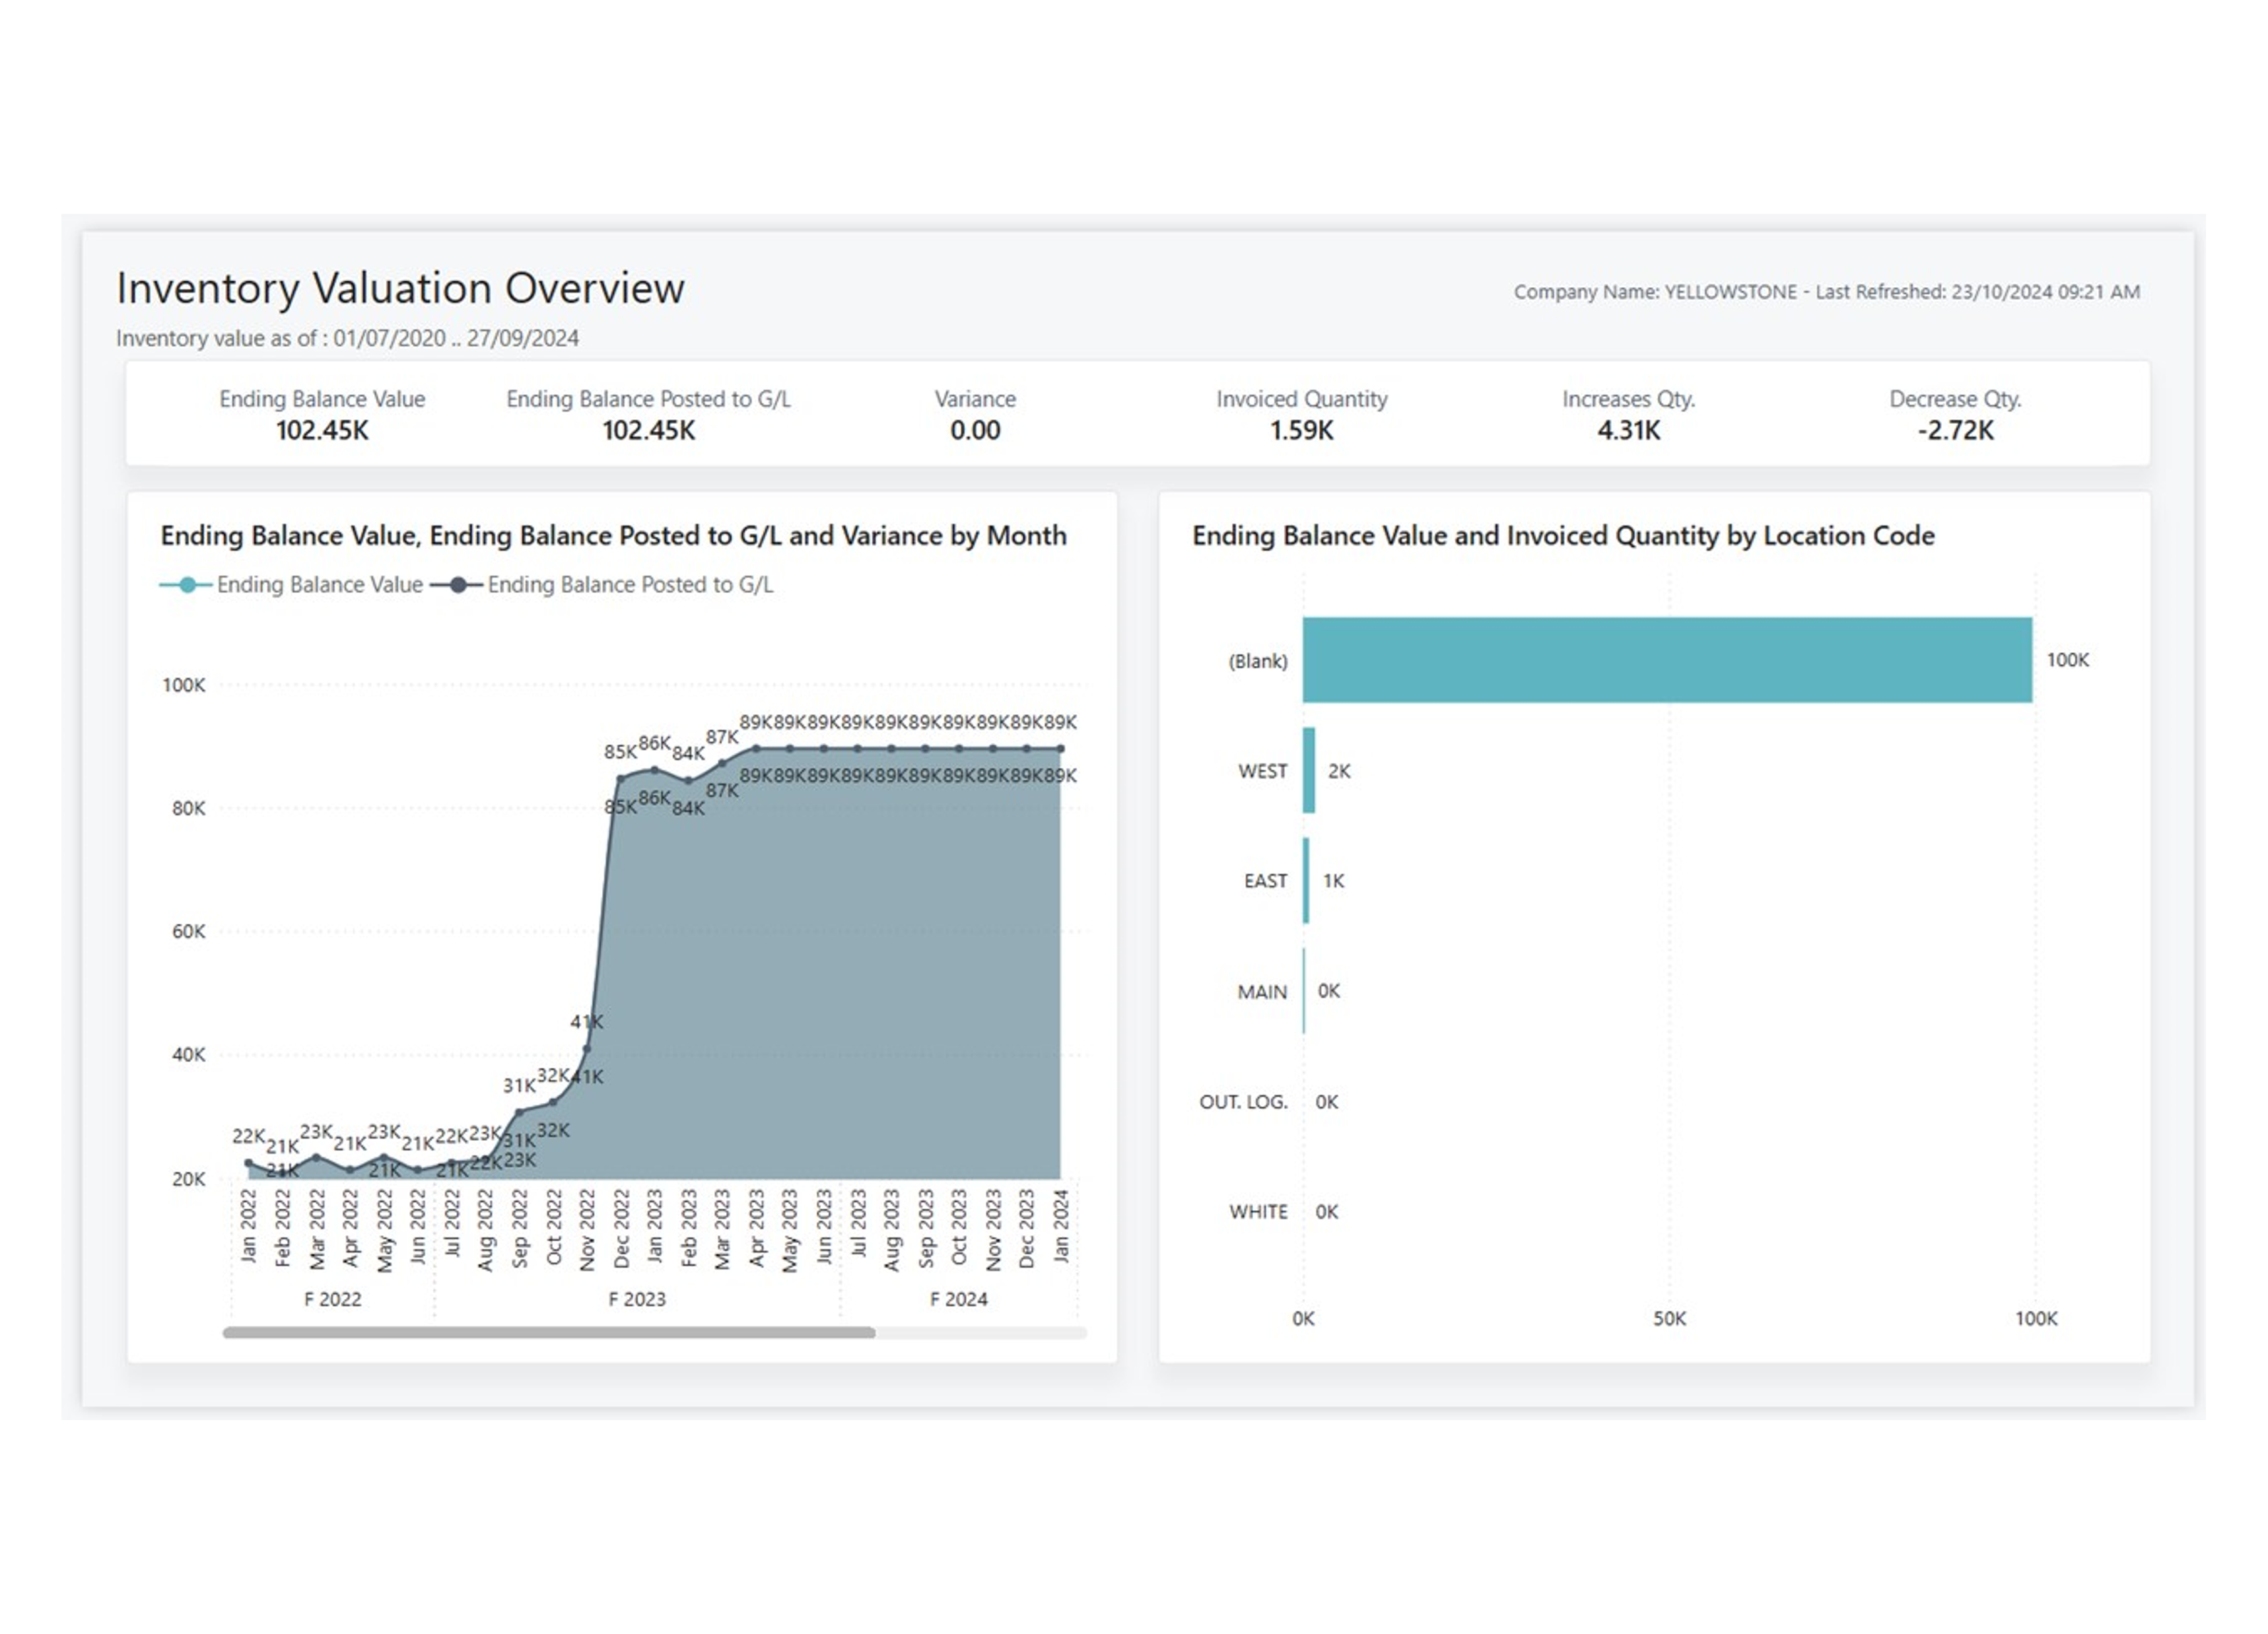
Inventory Valuation Power BI app
Visualize aspects of your inventory valuation processes in Dynamics 365 Business Central with this Power BI app.
Explore and monitor key inventory valuation reports and metrics in Power BI by connecting to your Dynamics 365 Business Central online data.
With the Business Central Inventory Valuation app, you get a Power BI dashboard and report with insights about your inventory valuation reporting and KPIs.
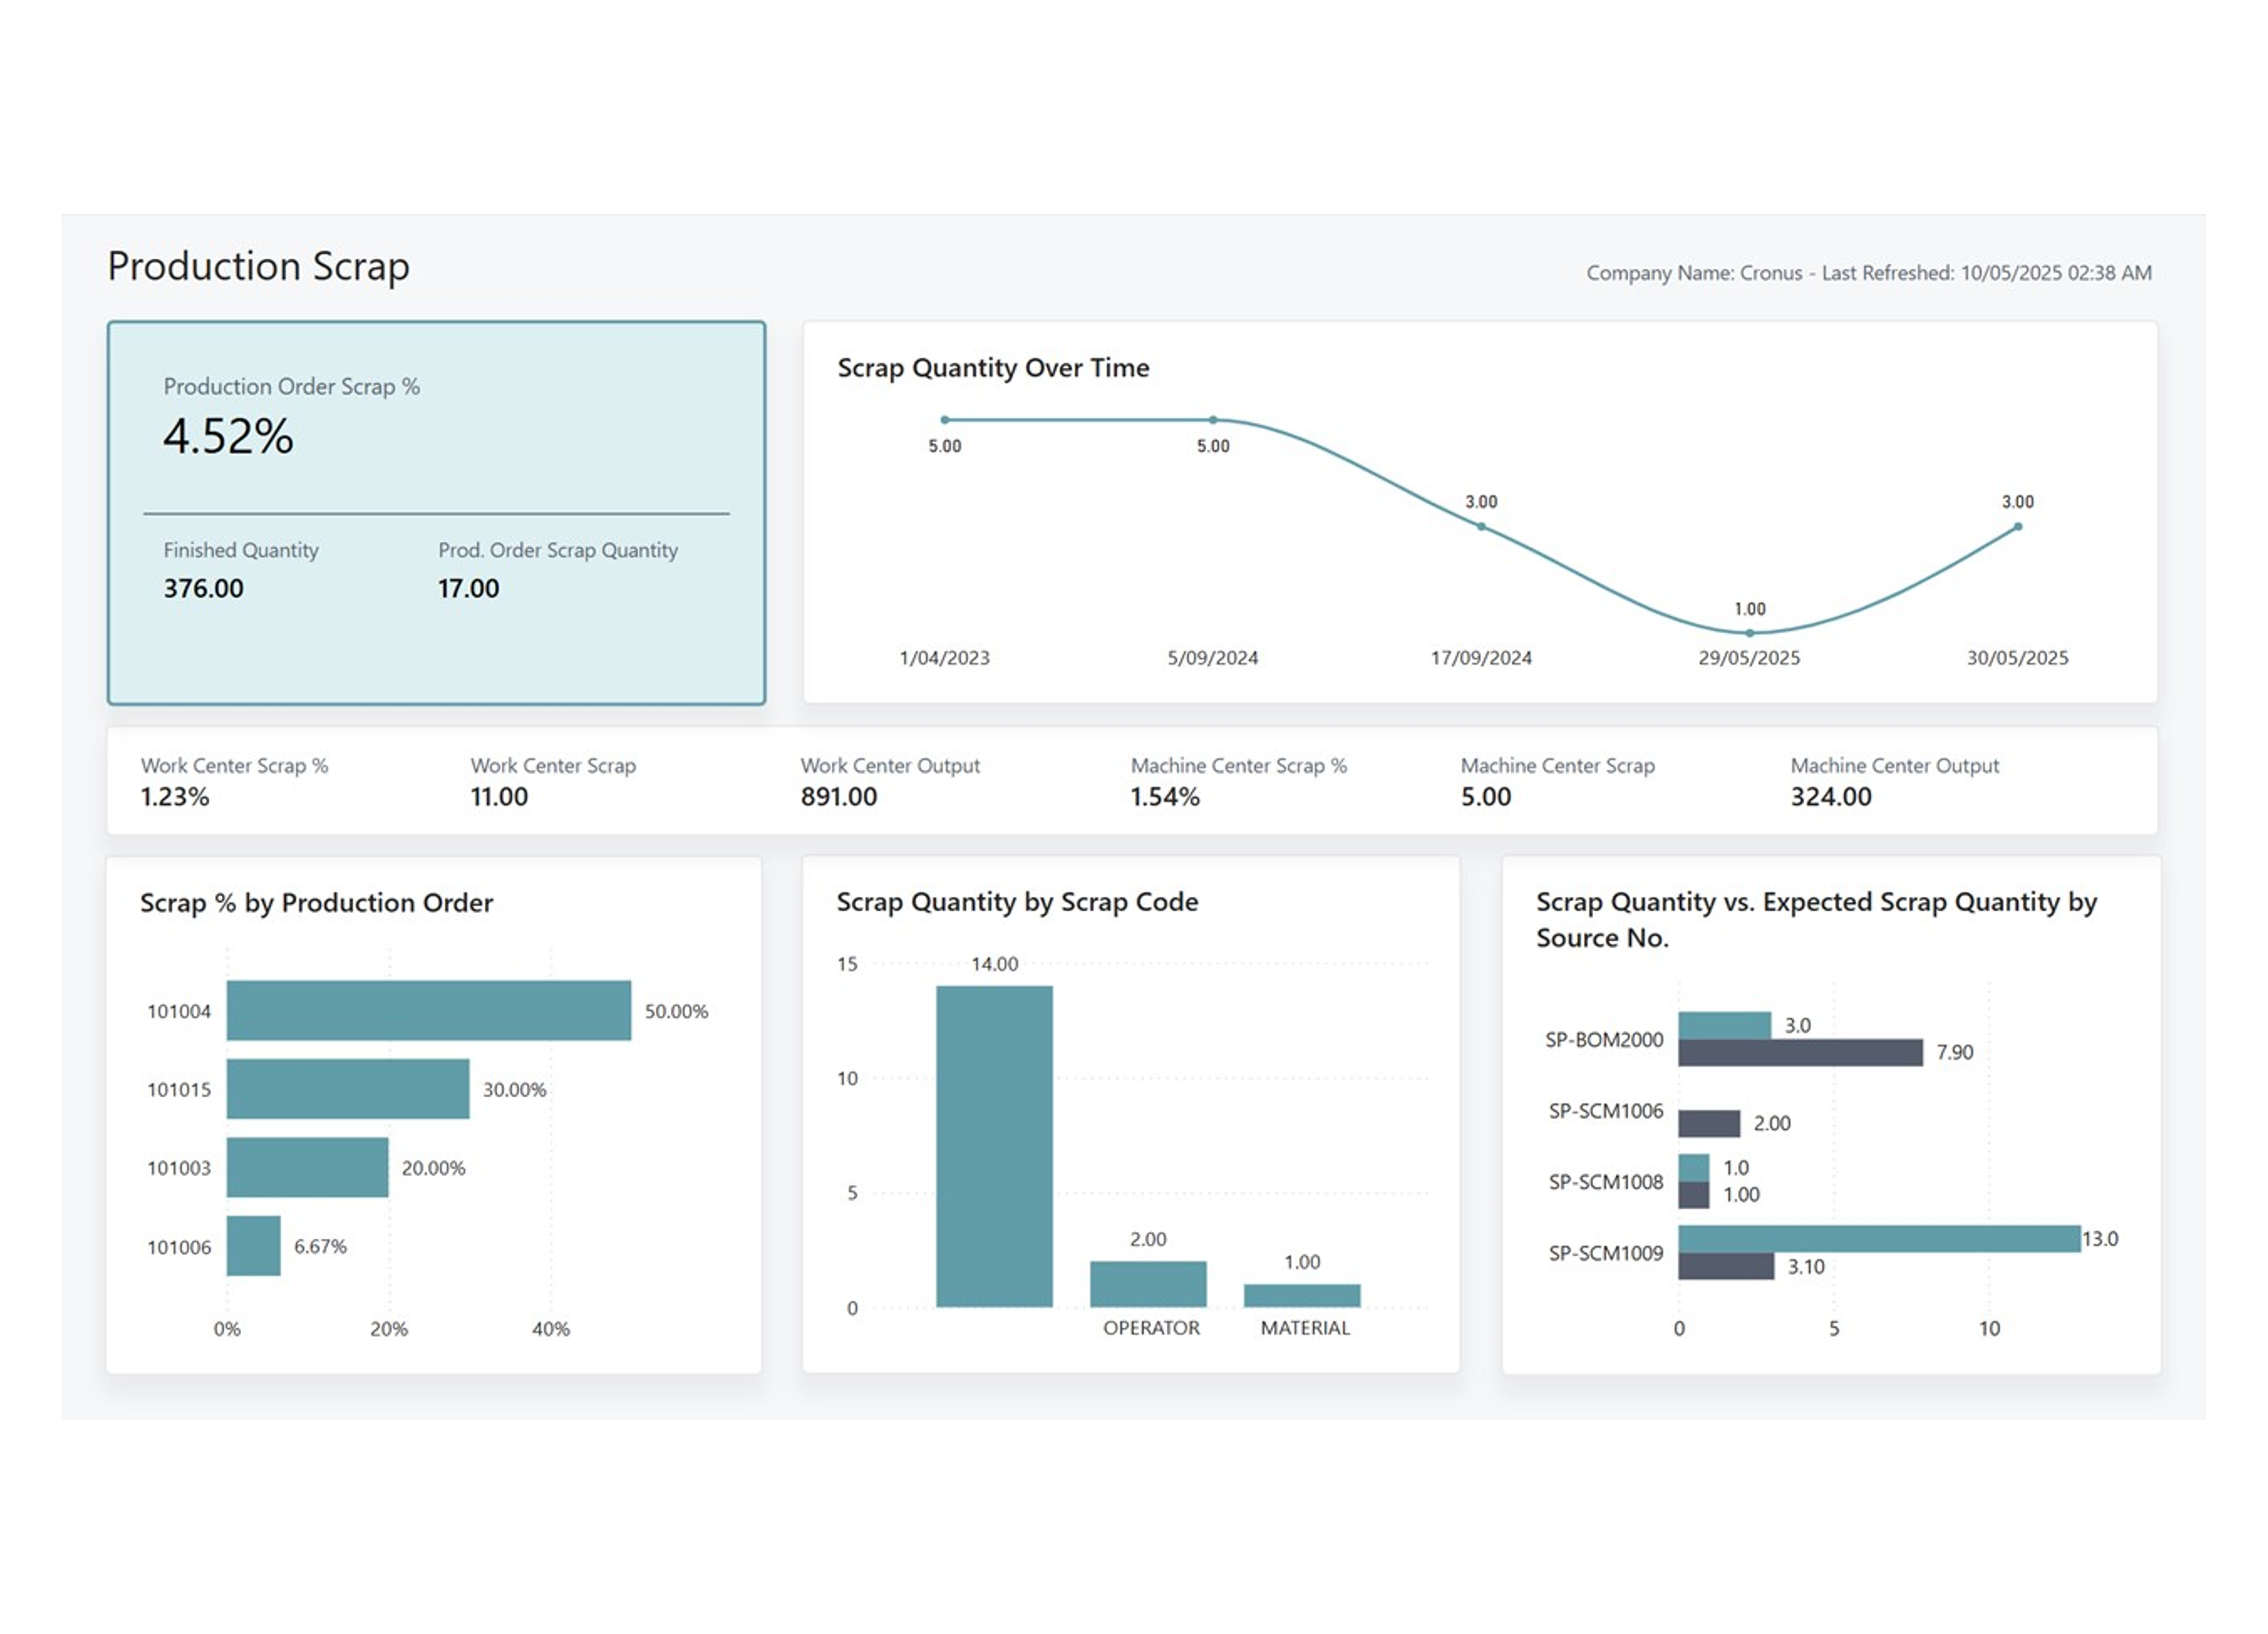
Manufacturing Power BI app
The Power BI Manufacturing app gives insights into your manufacturing activities. Its detailed analytics and visualizations of manufacturing data help:
- Streamline manufacturing processes
- Improve decision-making at all levels of the organization
- Optimize production efficiency
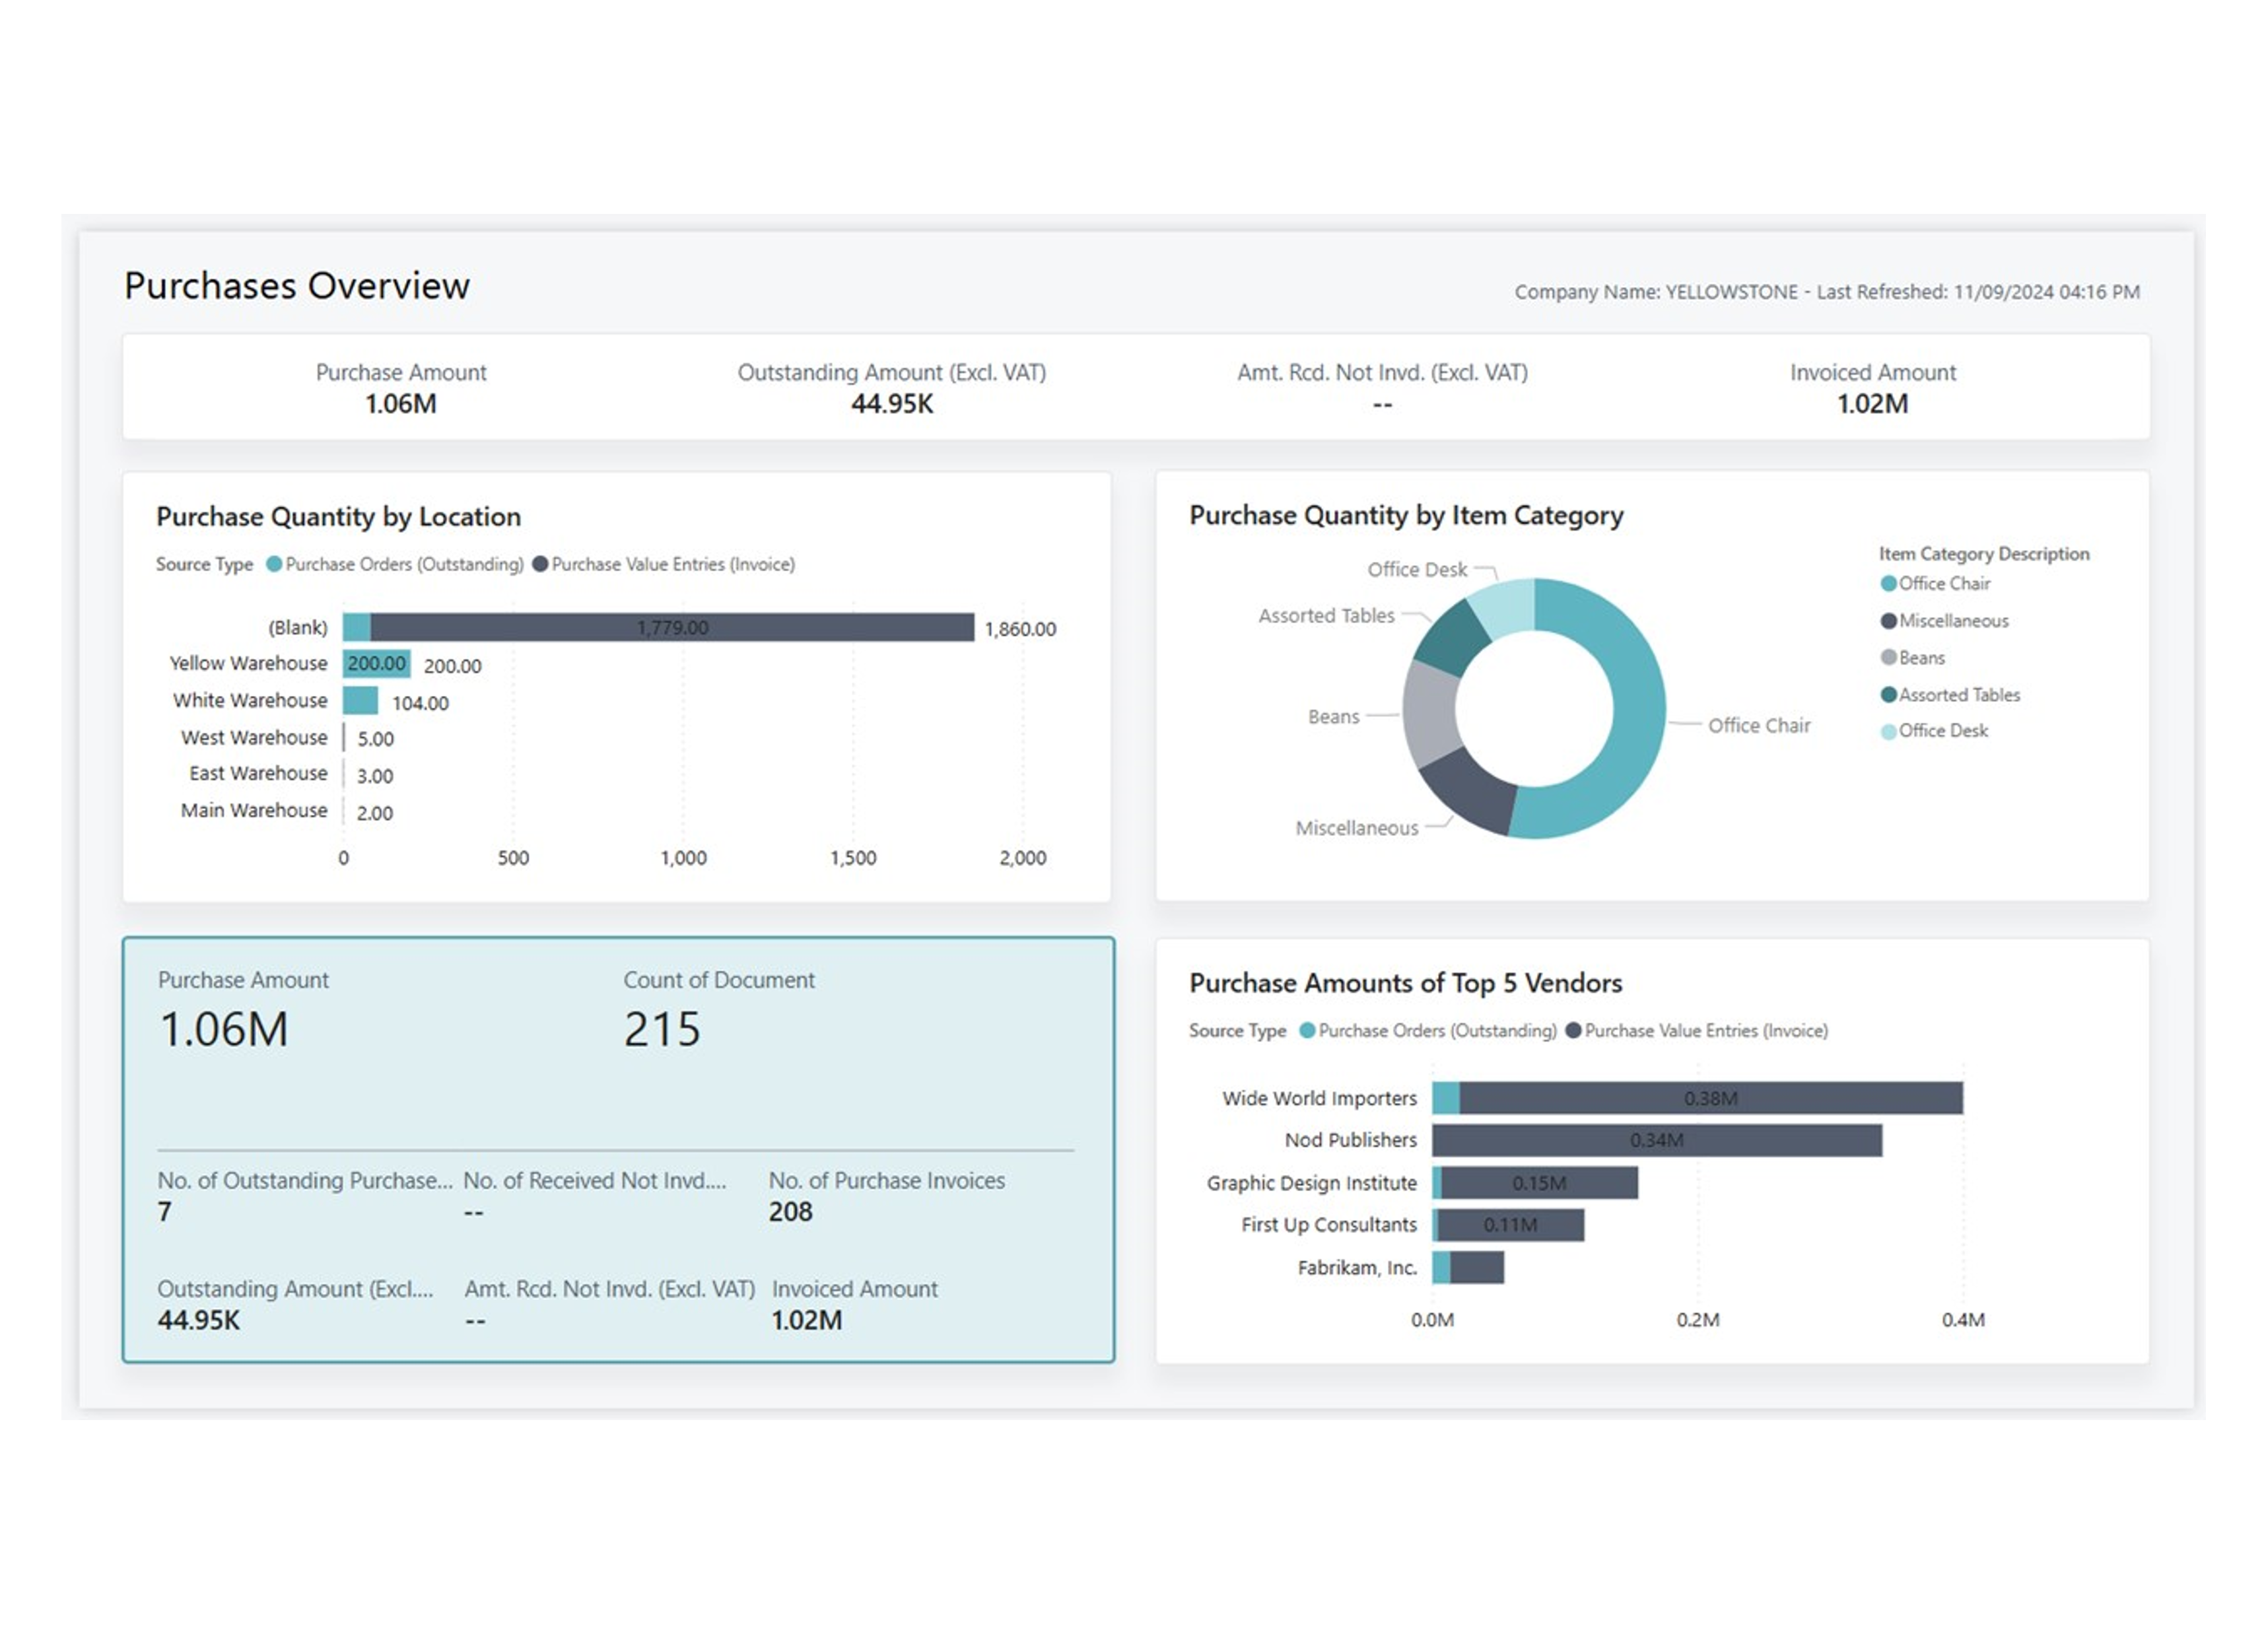
Purchasing Power BI app
The Power BI Purchasing app for Business Central provides executives, purchasing managers, and procurement teams with valuable insights into purchasing activities.
This app can help you streamline purchasing processes, improve decision-making at all levels of the organization, and optimize spending by offering detailed analytics and visualizations of purchasing data.
Use its reports to increase transparency, efficiency, and cost savings in your daily operations
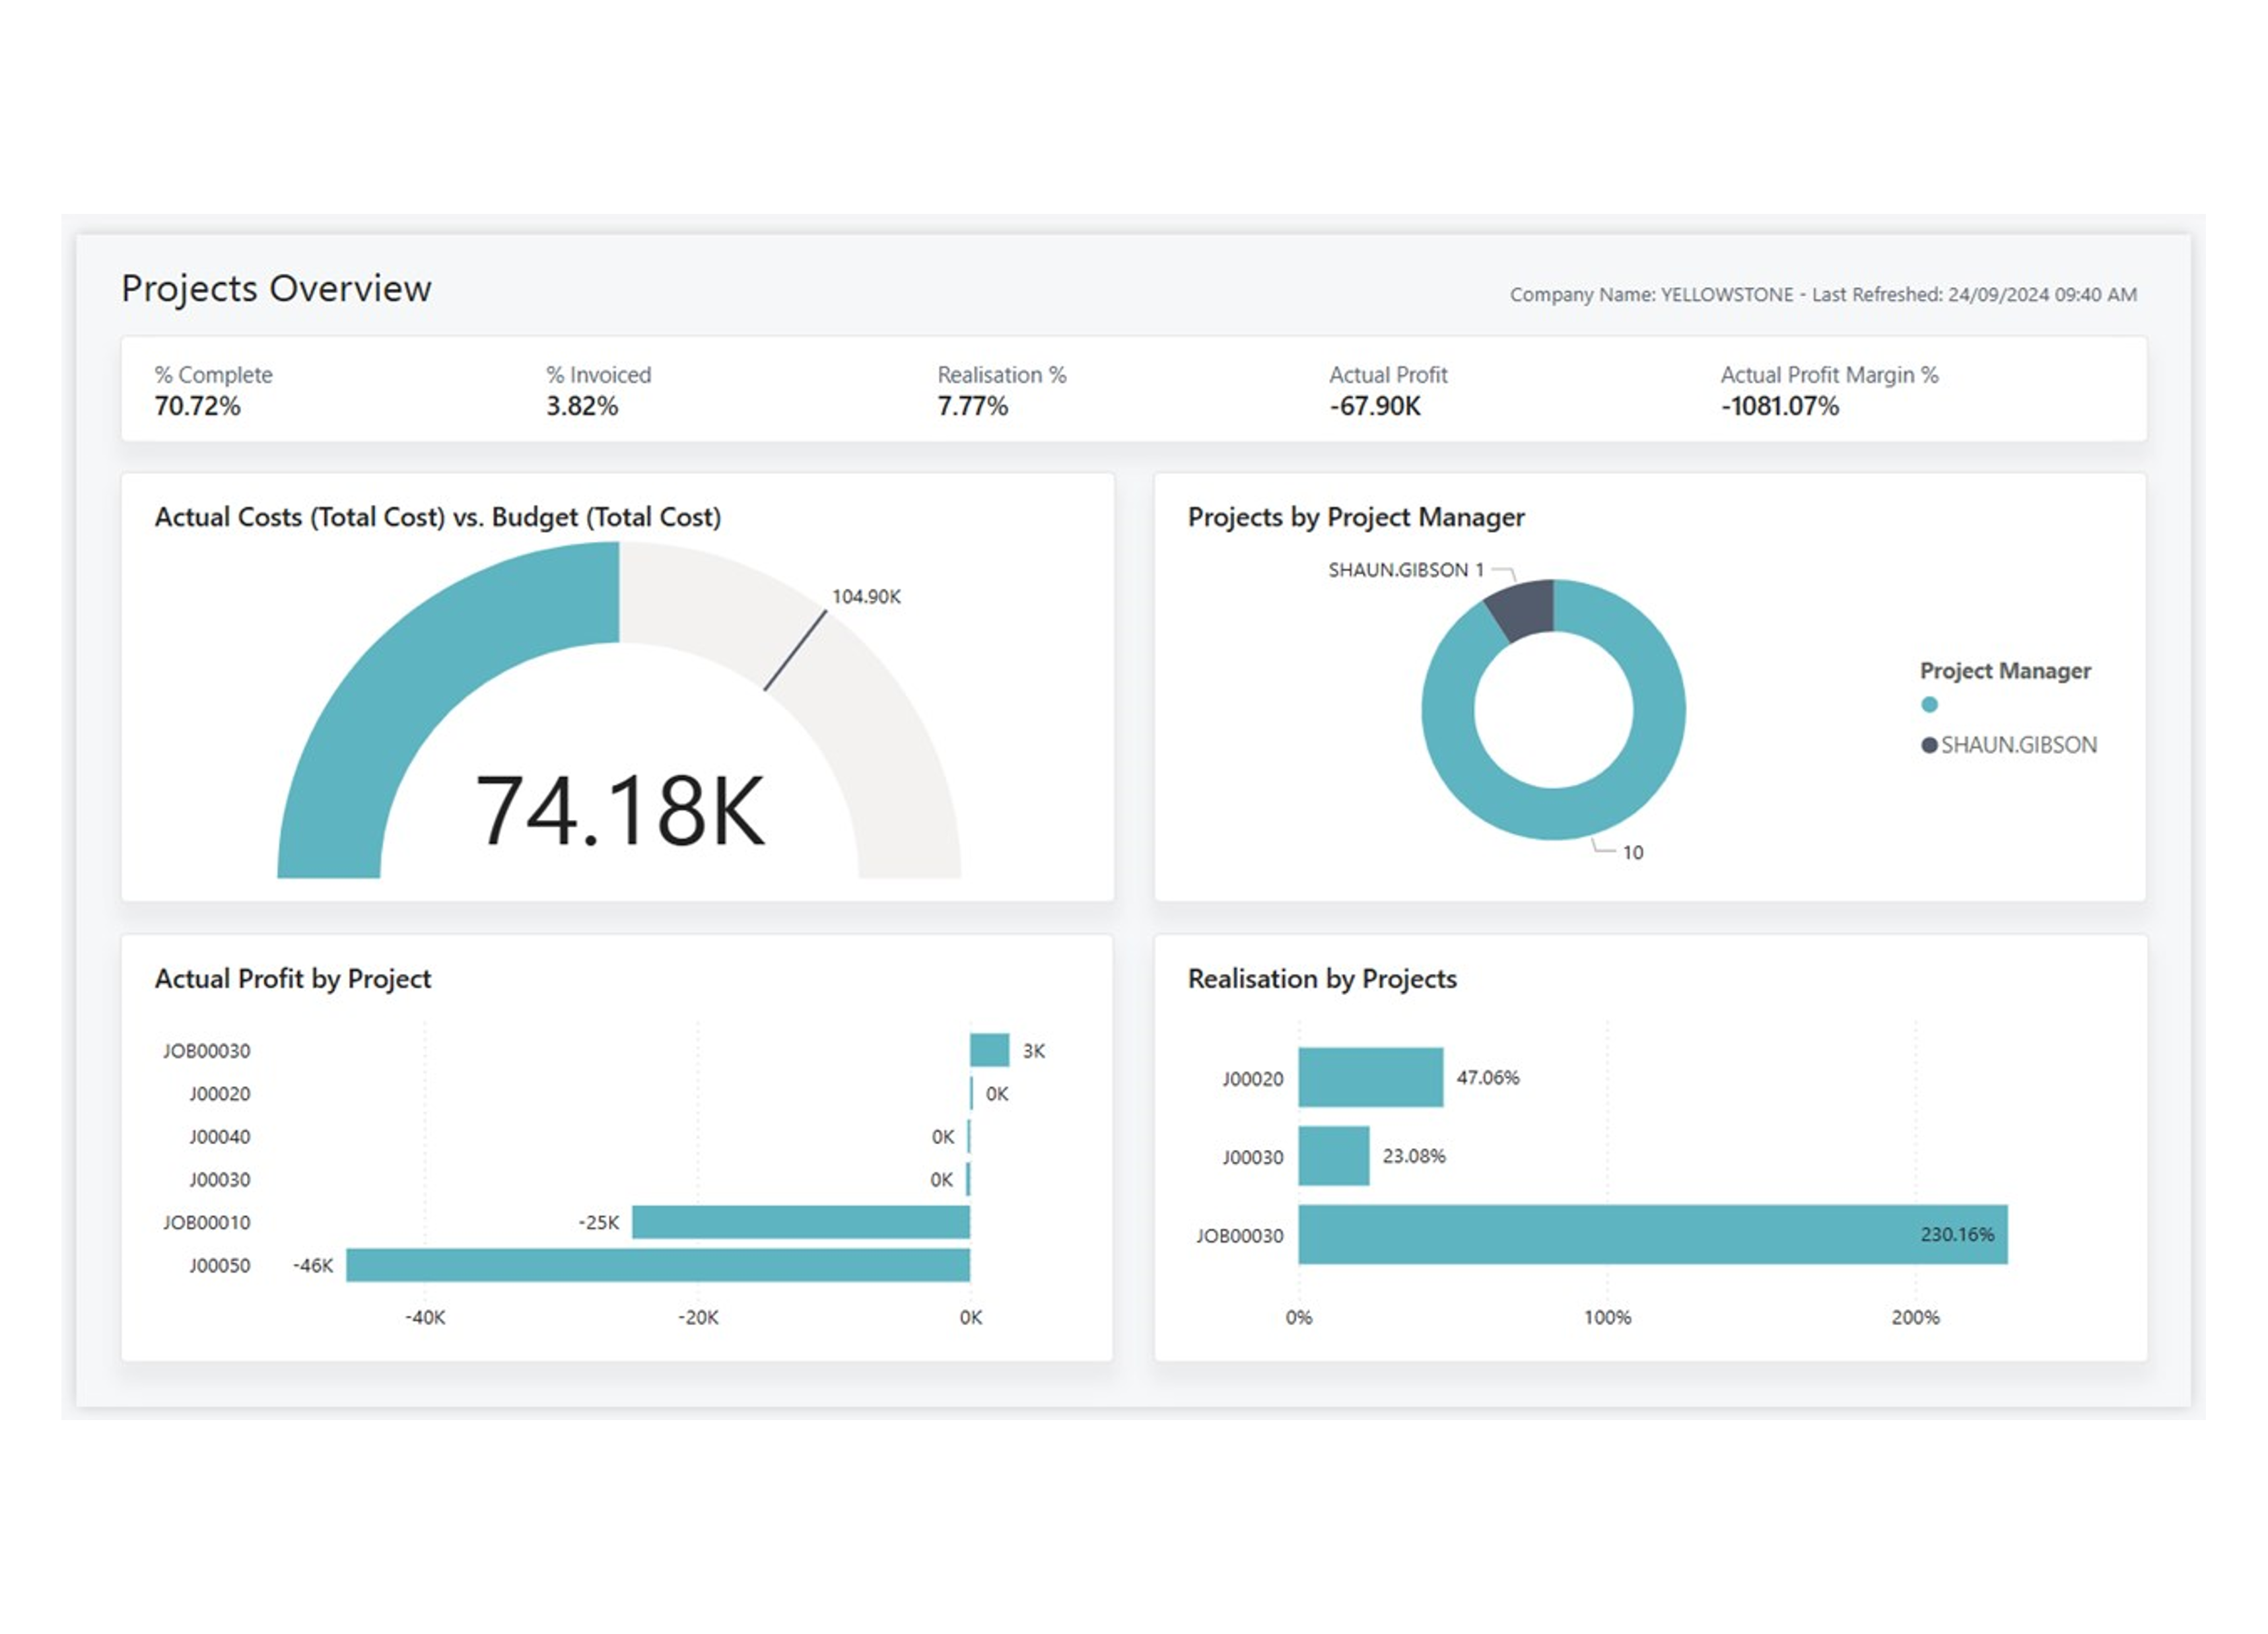
Projects Power BI app
Visualize aspects of your project processes in Dynamics 365 Business Central with this Power BI app.
Explore and monitor key project reports and metrics in Power BI by connecting to your Dynamics 365 Business Central online data.
With the Business Central Projects app, you get a Power BI dashboard and report with insights about your project reporting and KPIs.
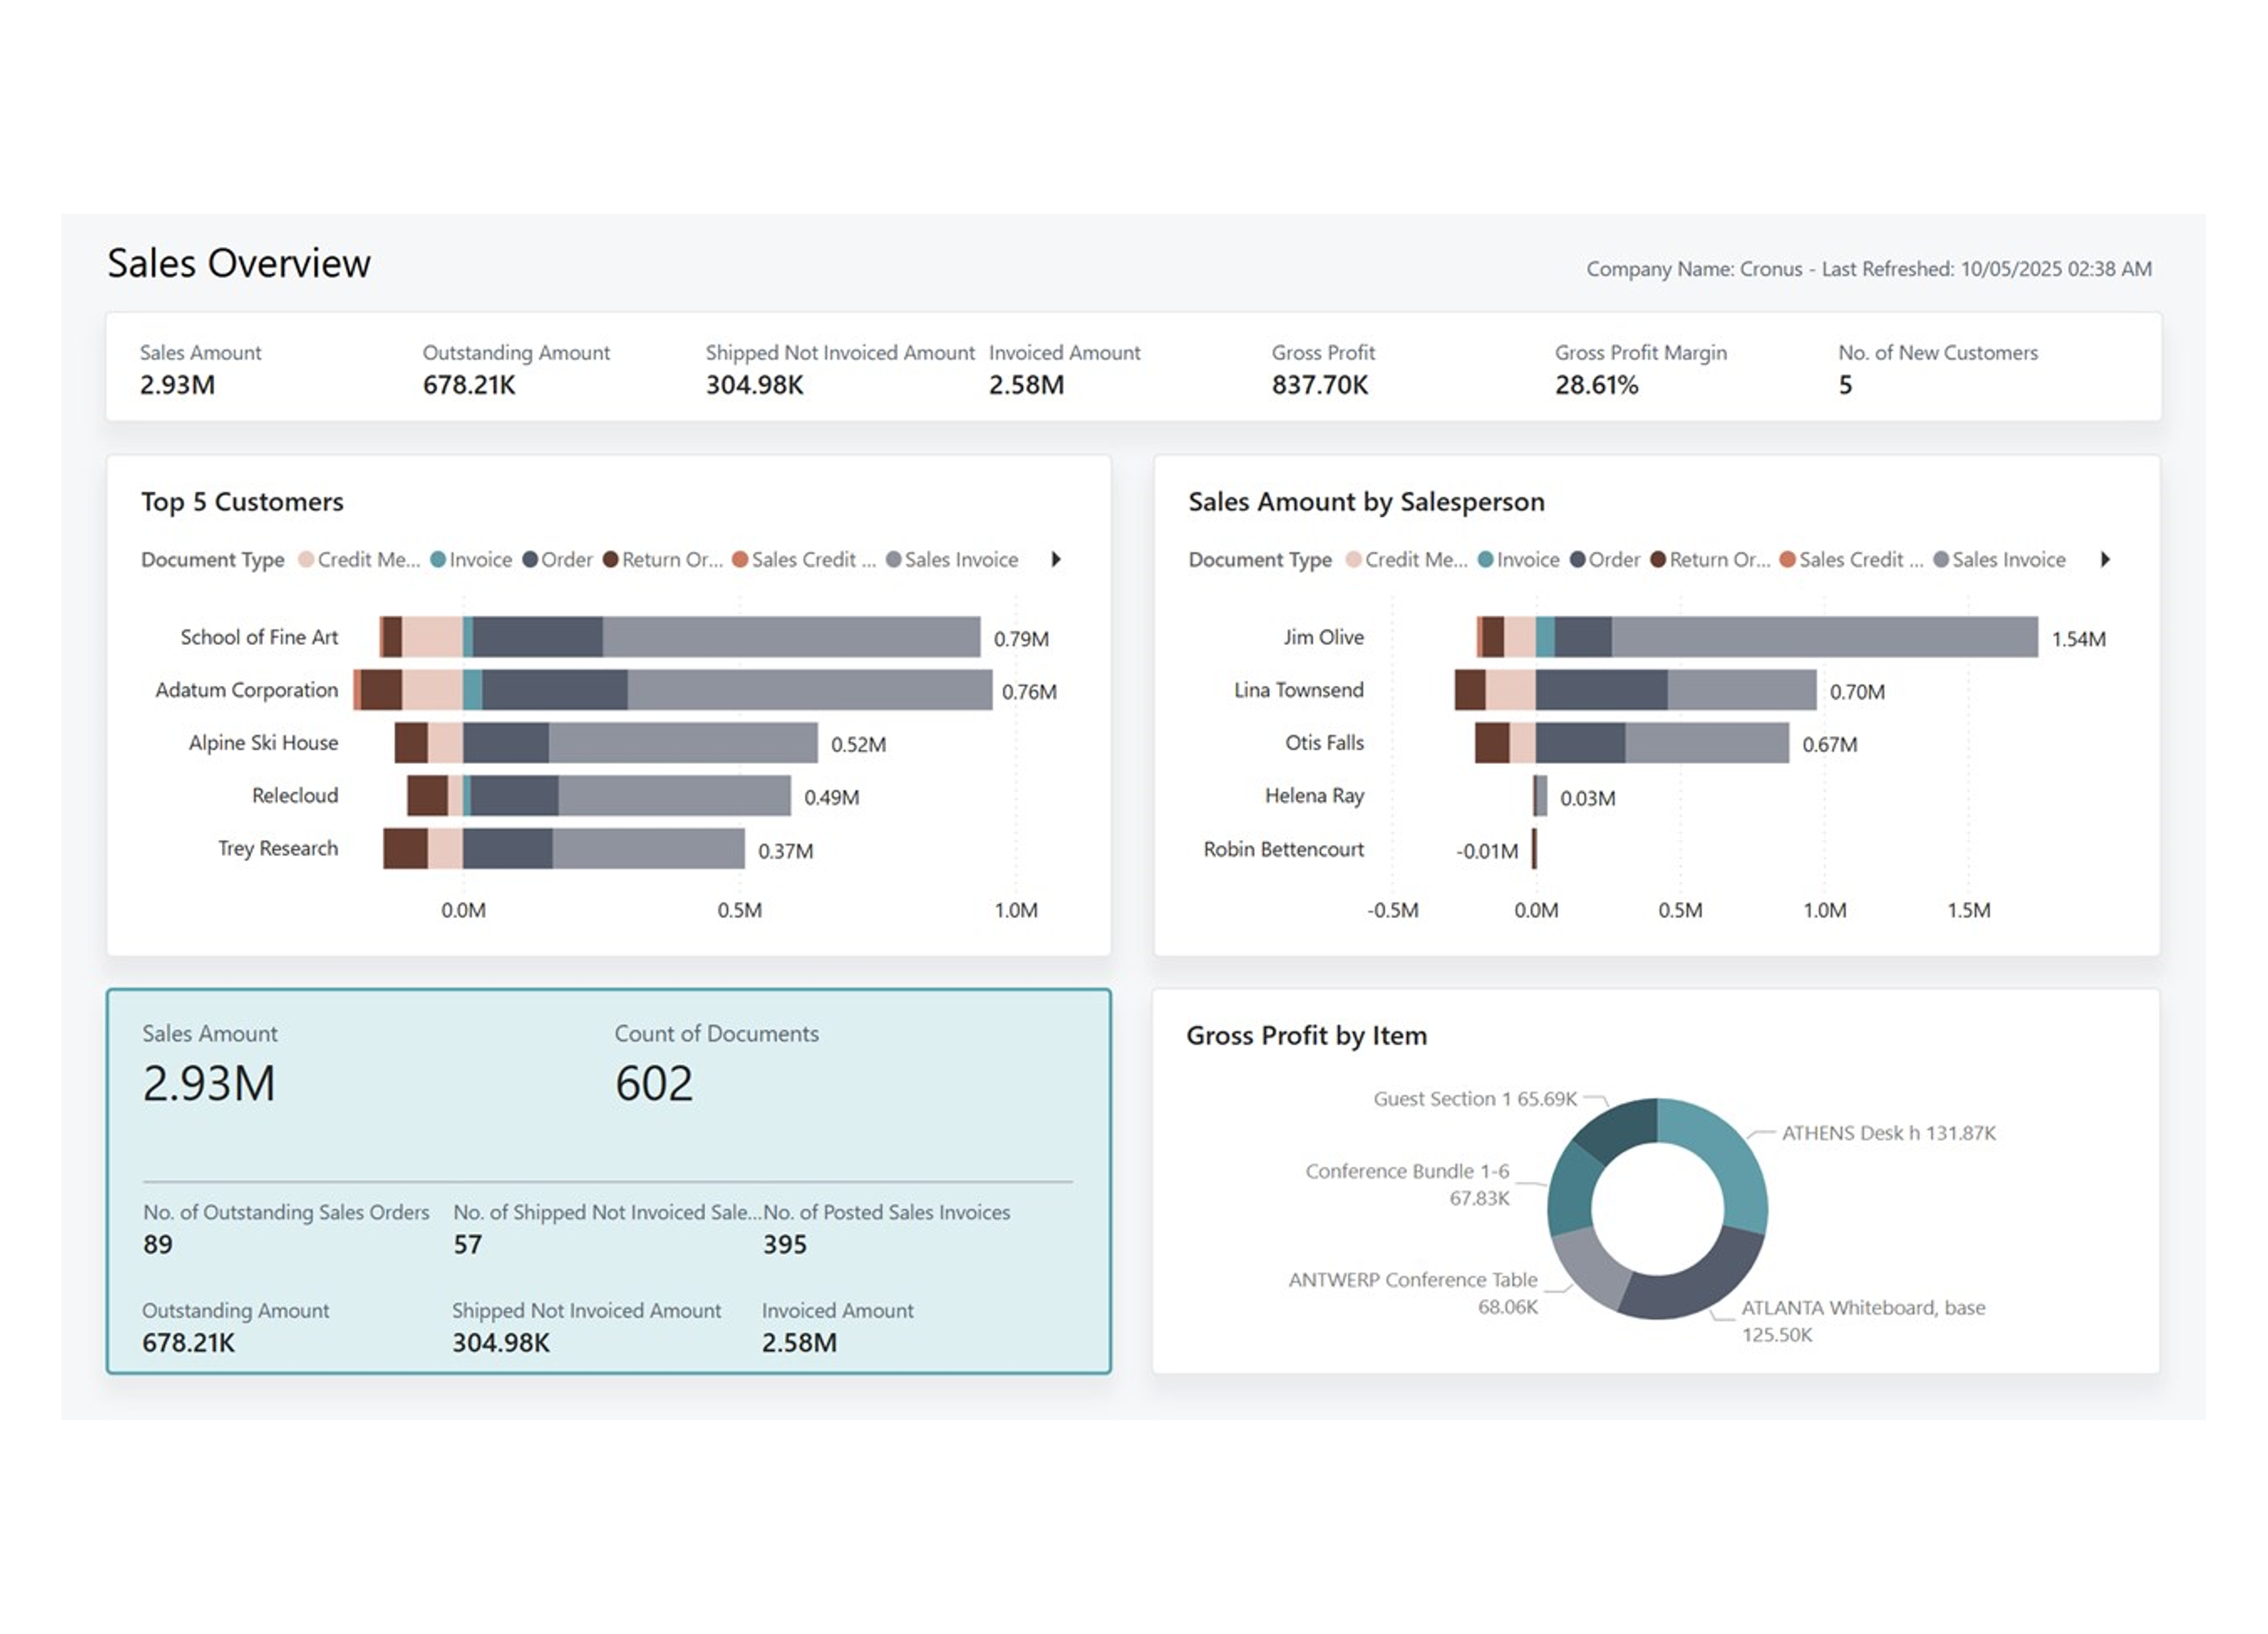
Sales Power BI app
The reports in the Power BI Sales app provide comprehensive sales analytics to stakeholders at all levels of your organization.
Executives and the leadership team can use the Sales Overview, Period-Over-Period Growth, and Month-To-Date reports to identify trends in sales performance.
Managers and team leaders can track individual sales team performance using the Sales by Salesperson report. They can also monitor overall team progress toward meeting sales goals by comparing actual results against targets in the Actual vs. Budget report.
Sales teams can use aggregated reports, such as the Sales by Item and Sales by Customer reports, to identify top-selling items and the customers that generate the most revenue. You can drill down from these aggregated views into transaction-level data for more detailed analyses.
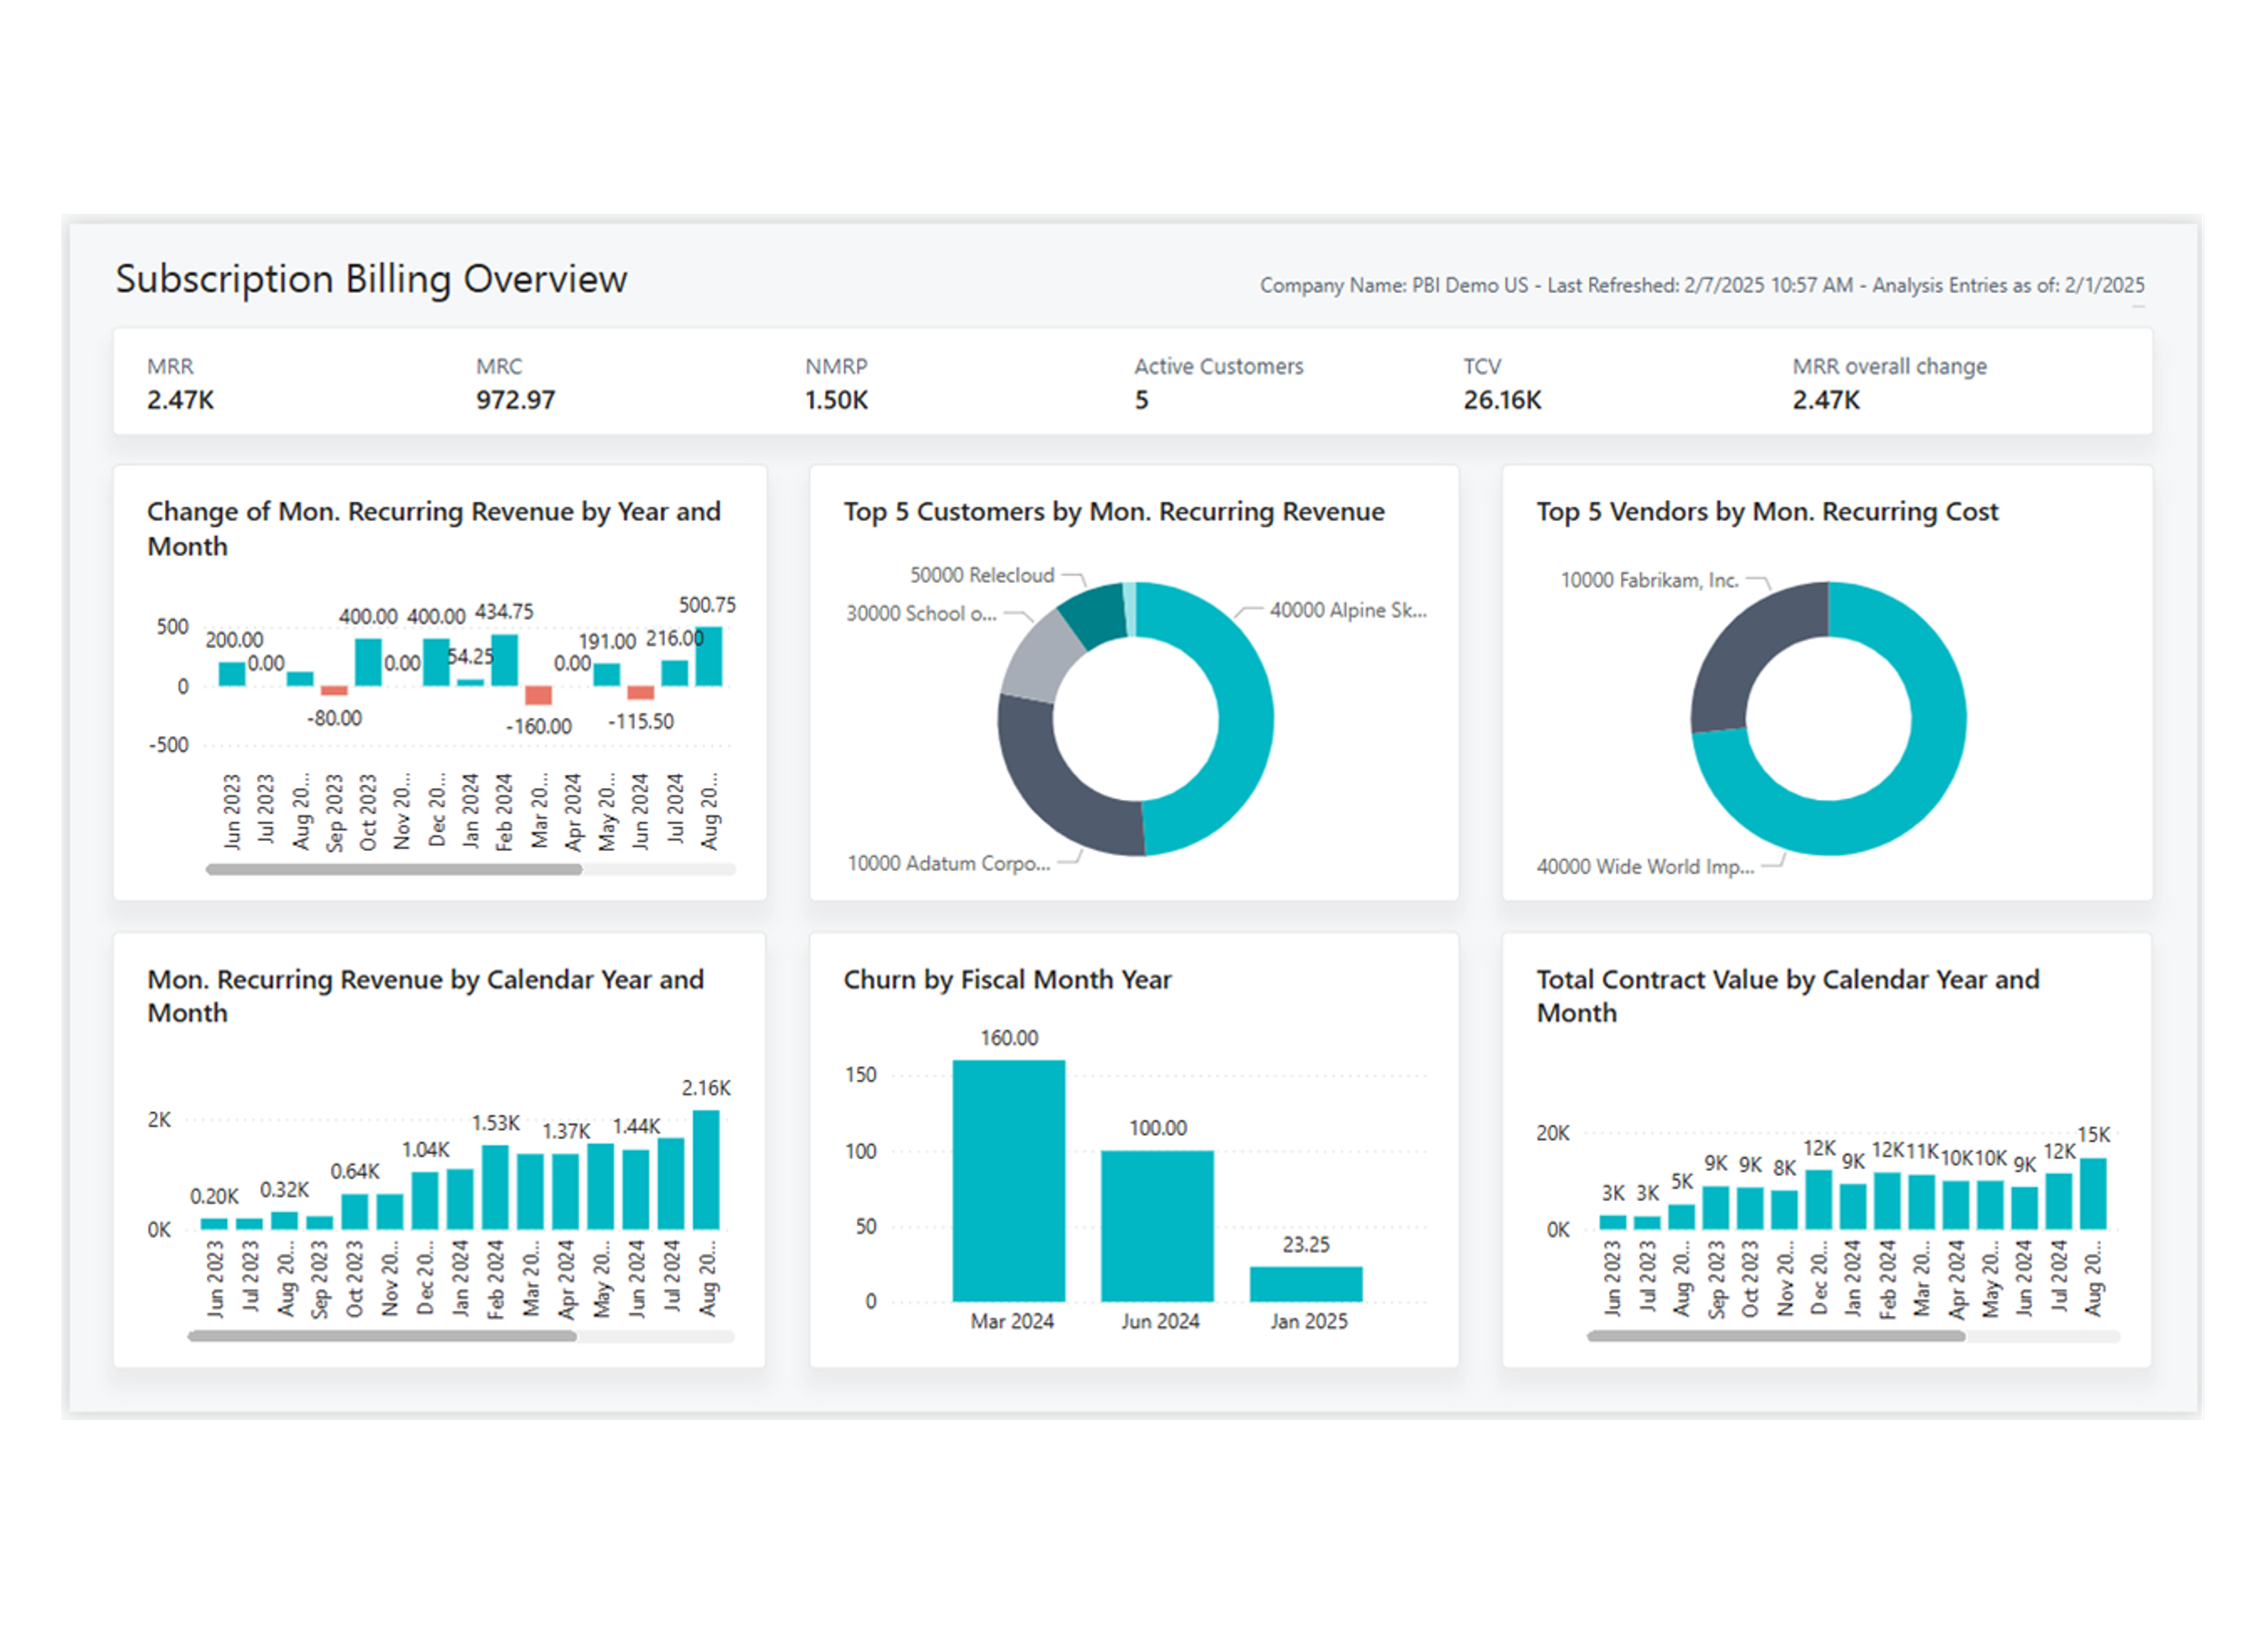
Subscription Billing Power BI app
The Power BI Subscription Billing app delivers insight into the performance and health of your subscription business. It brings together the key metrics that define recurring revenue models, from monthly growth and churn to long-term contract value.
Executives and leadership teams can track overall growth and stability of their subscription business with the Subscription Overview, Revenue Year-over-Year and Total Contract Value Year-over-Year reports.
Finance and operations managers can dig deeper into the drivers of change. With the Revenue Development report that separates churn, upgrades, downgrades, and new business, they can explain why revenue is changing month by month. The Revenue Forecast report supports planning by providing a forward-looking view of recurring revenue.
Subscription managers, sales, and accounting teams can use reports for their daily work. Customer Deferrals and Vendor Deferrals reports allow them to validate that revenue and costs are recognized correctly, while the Billing Schedule report helps confirm that all contracts are invoiced as expected.
Custom Power BI Solutions
For when the standard 'out the box' Power BI reports dont quite meet your needs.
We write Power BI solutions customised to your requirements, still with direct feeds from Business Central, automatically scheduled leaving you ready for deep dive analysis.
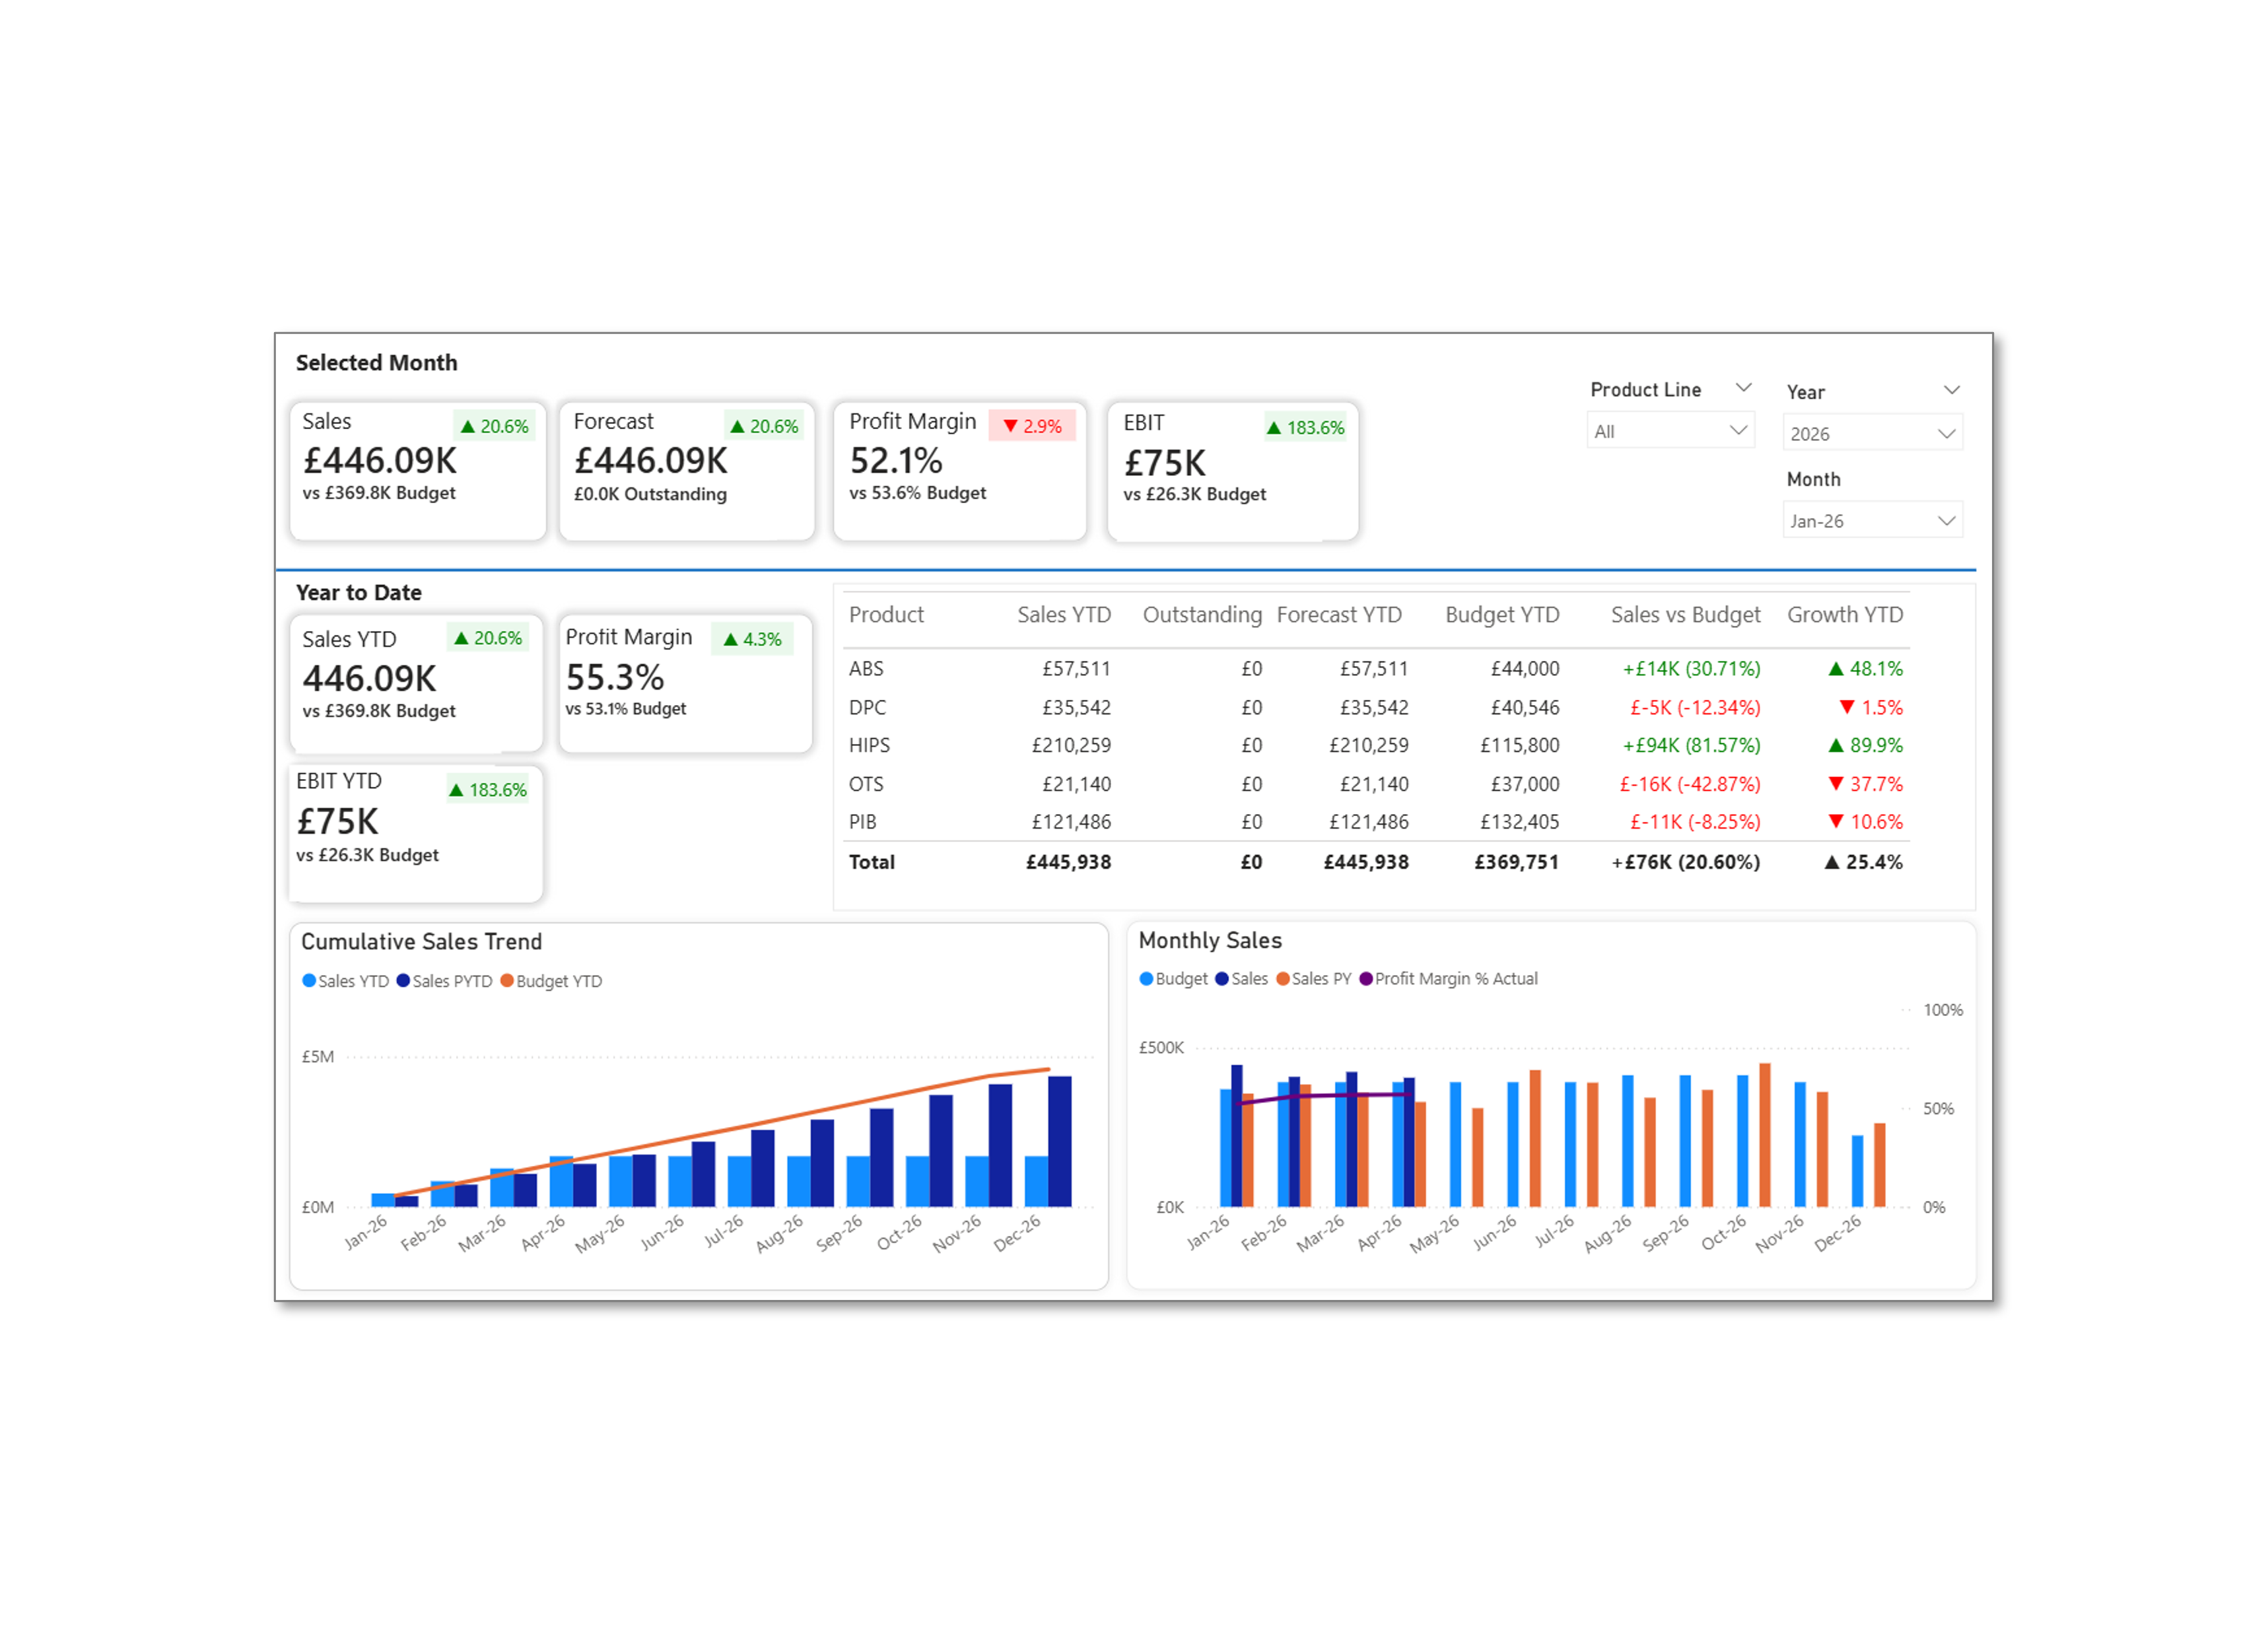
Divisional Sales Analysis Dashboard
Our client required a custom suite of reports tuned to their business needs, allowing them to analyse sales, profit and performance versus budget. The fully interactive Home page provided a rich display of data, taking advantage of KPIs and trend visuals for board presentations.
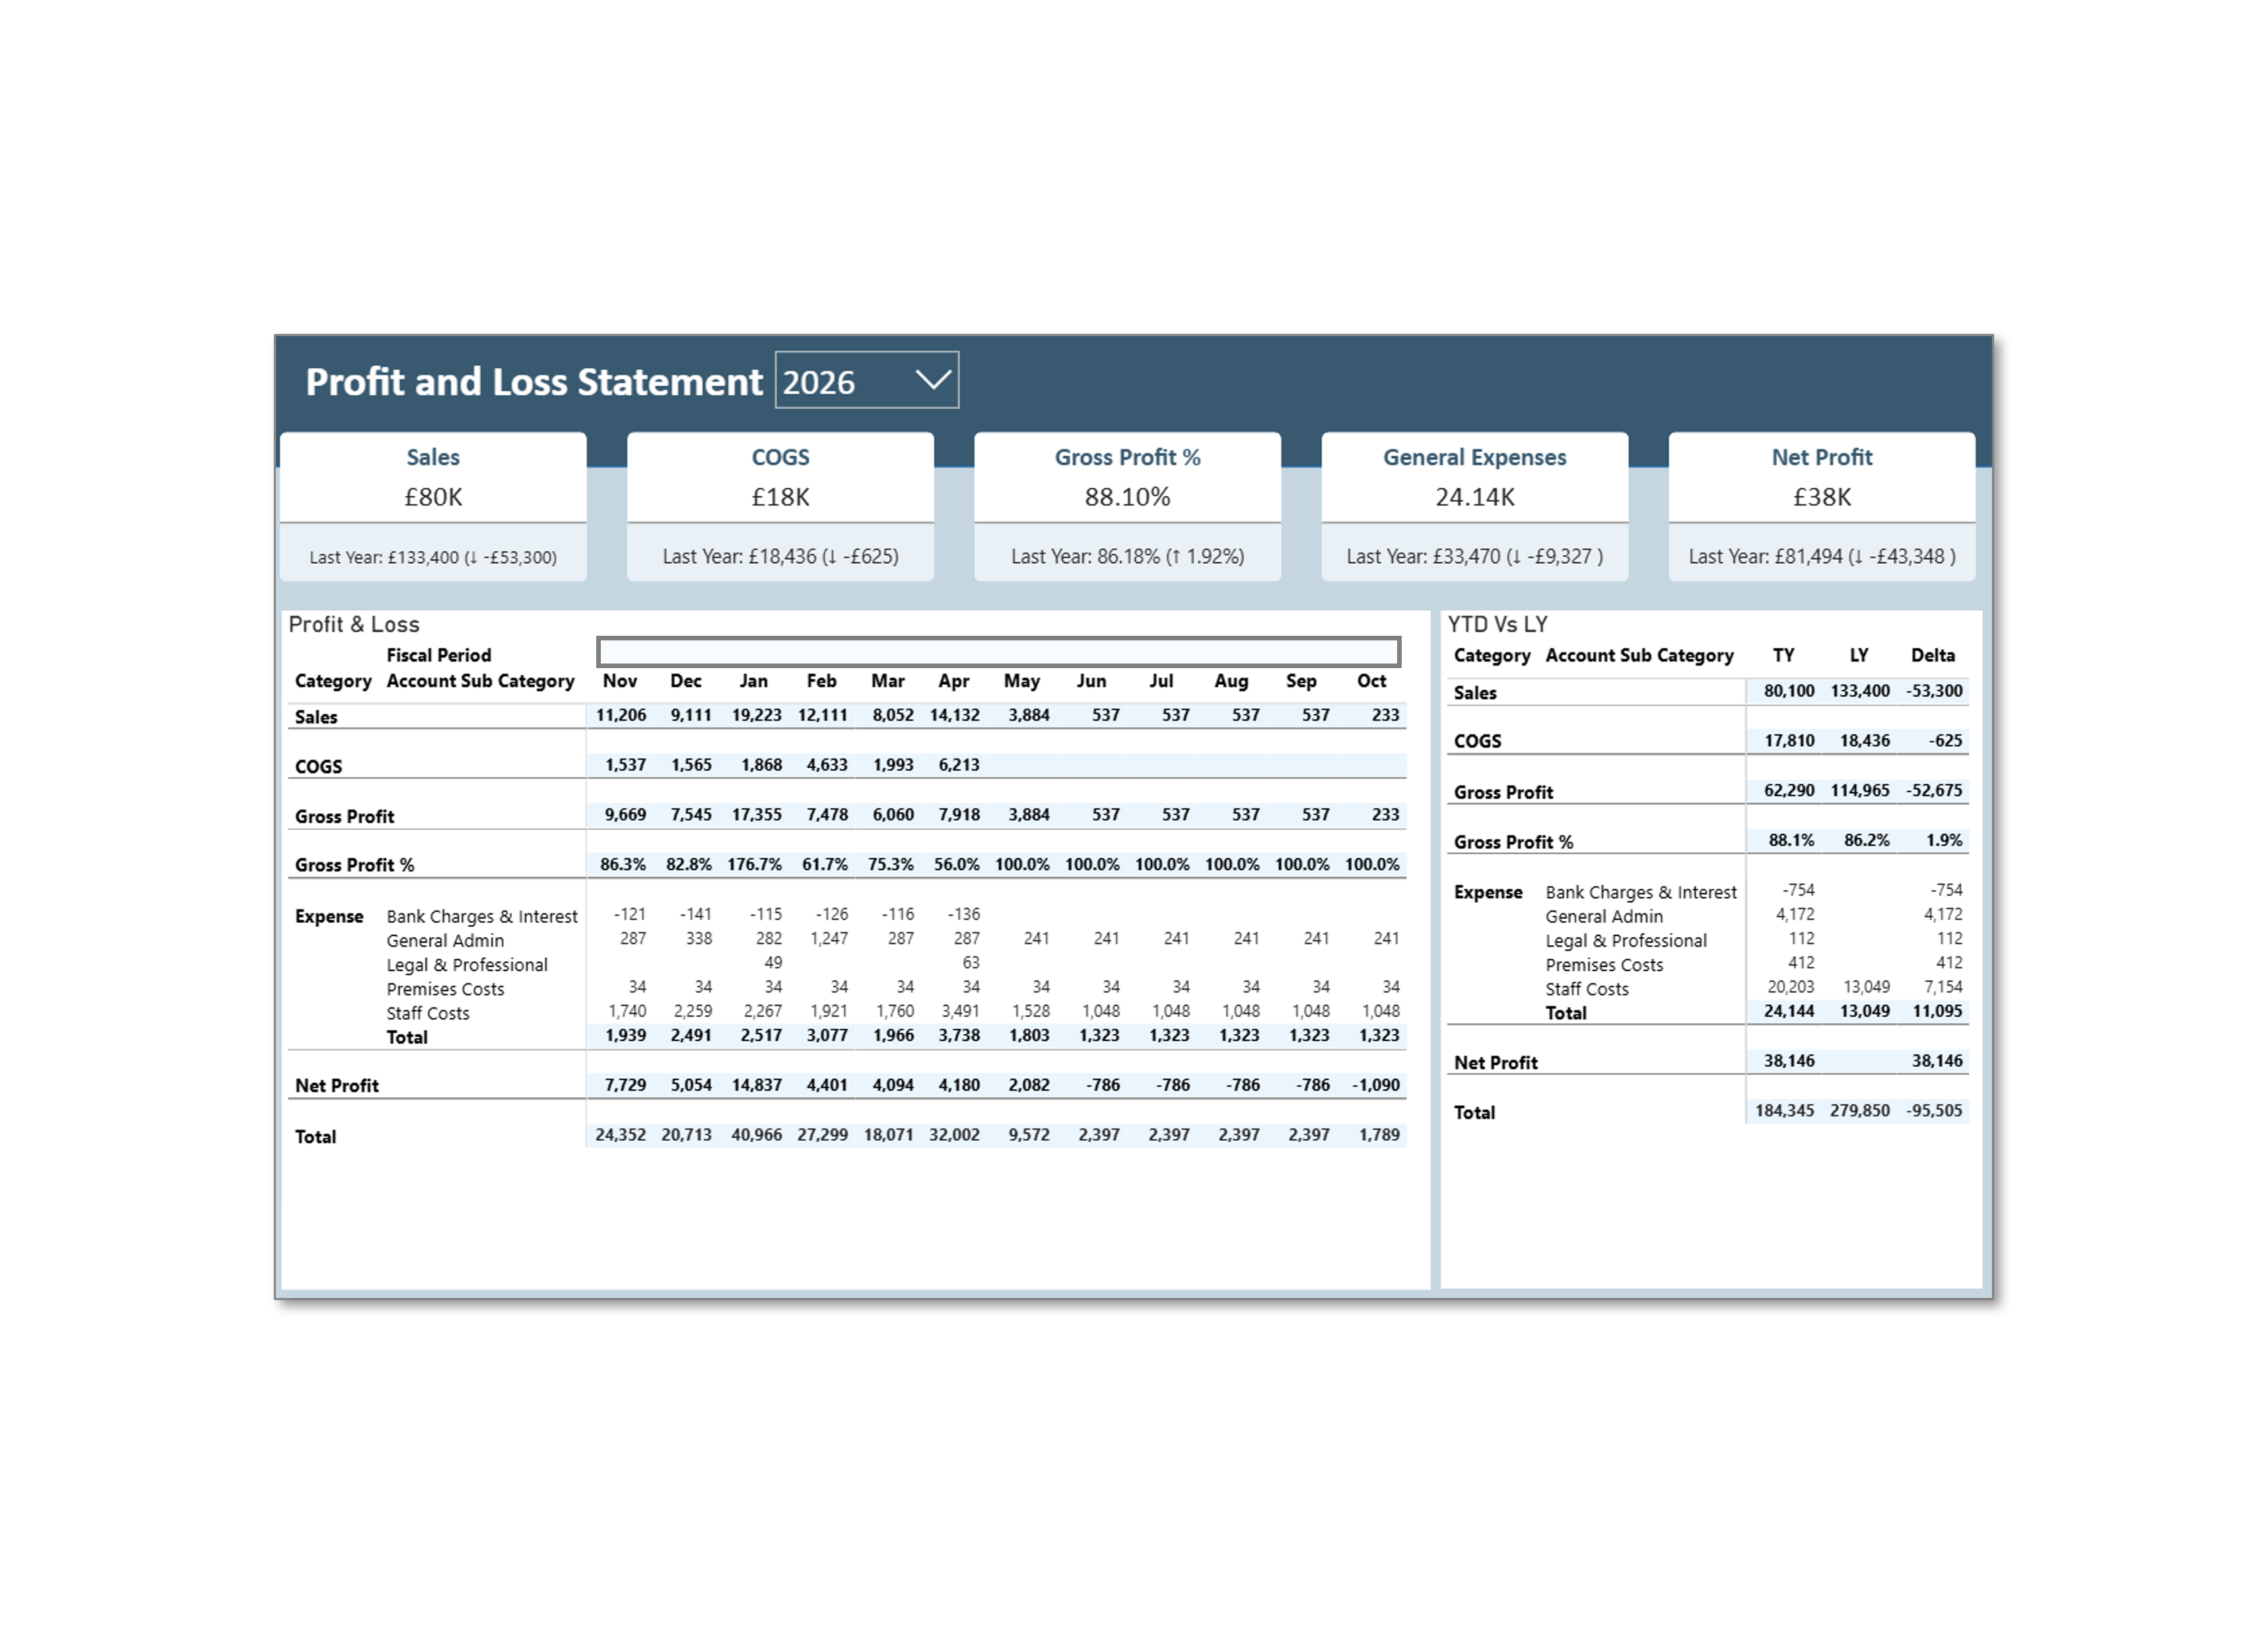
Simplified Profit & Loss
Whilst Power BI is perhaps not the best solution for financial statements, it's a common requirement for customers to present high level figures along with the board pack. For detailed financial statements we would always recommend Jet Reports for financial statements presented in Excel from a live Business Central feed.
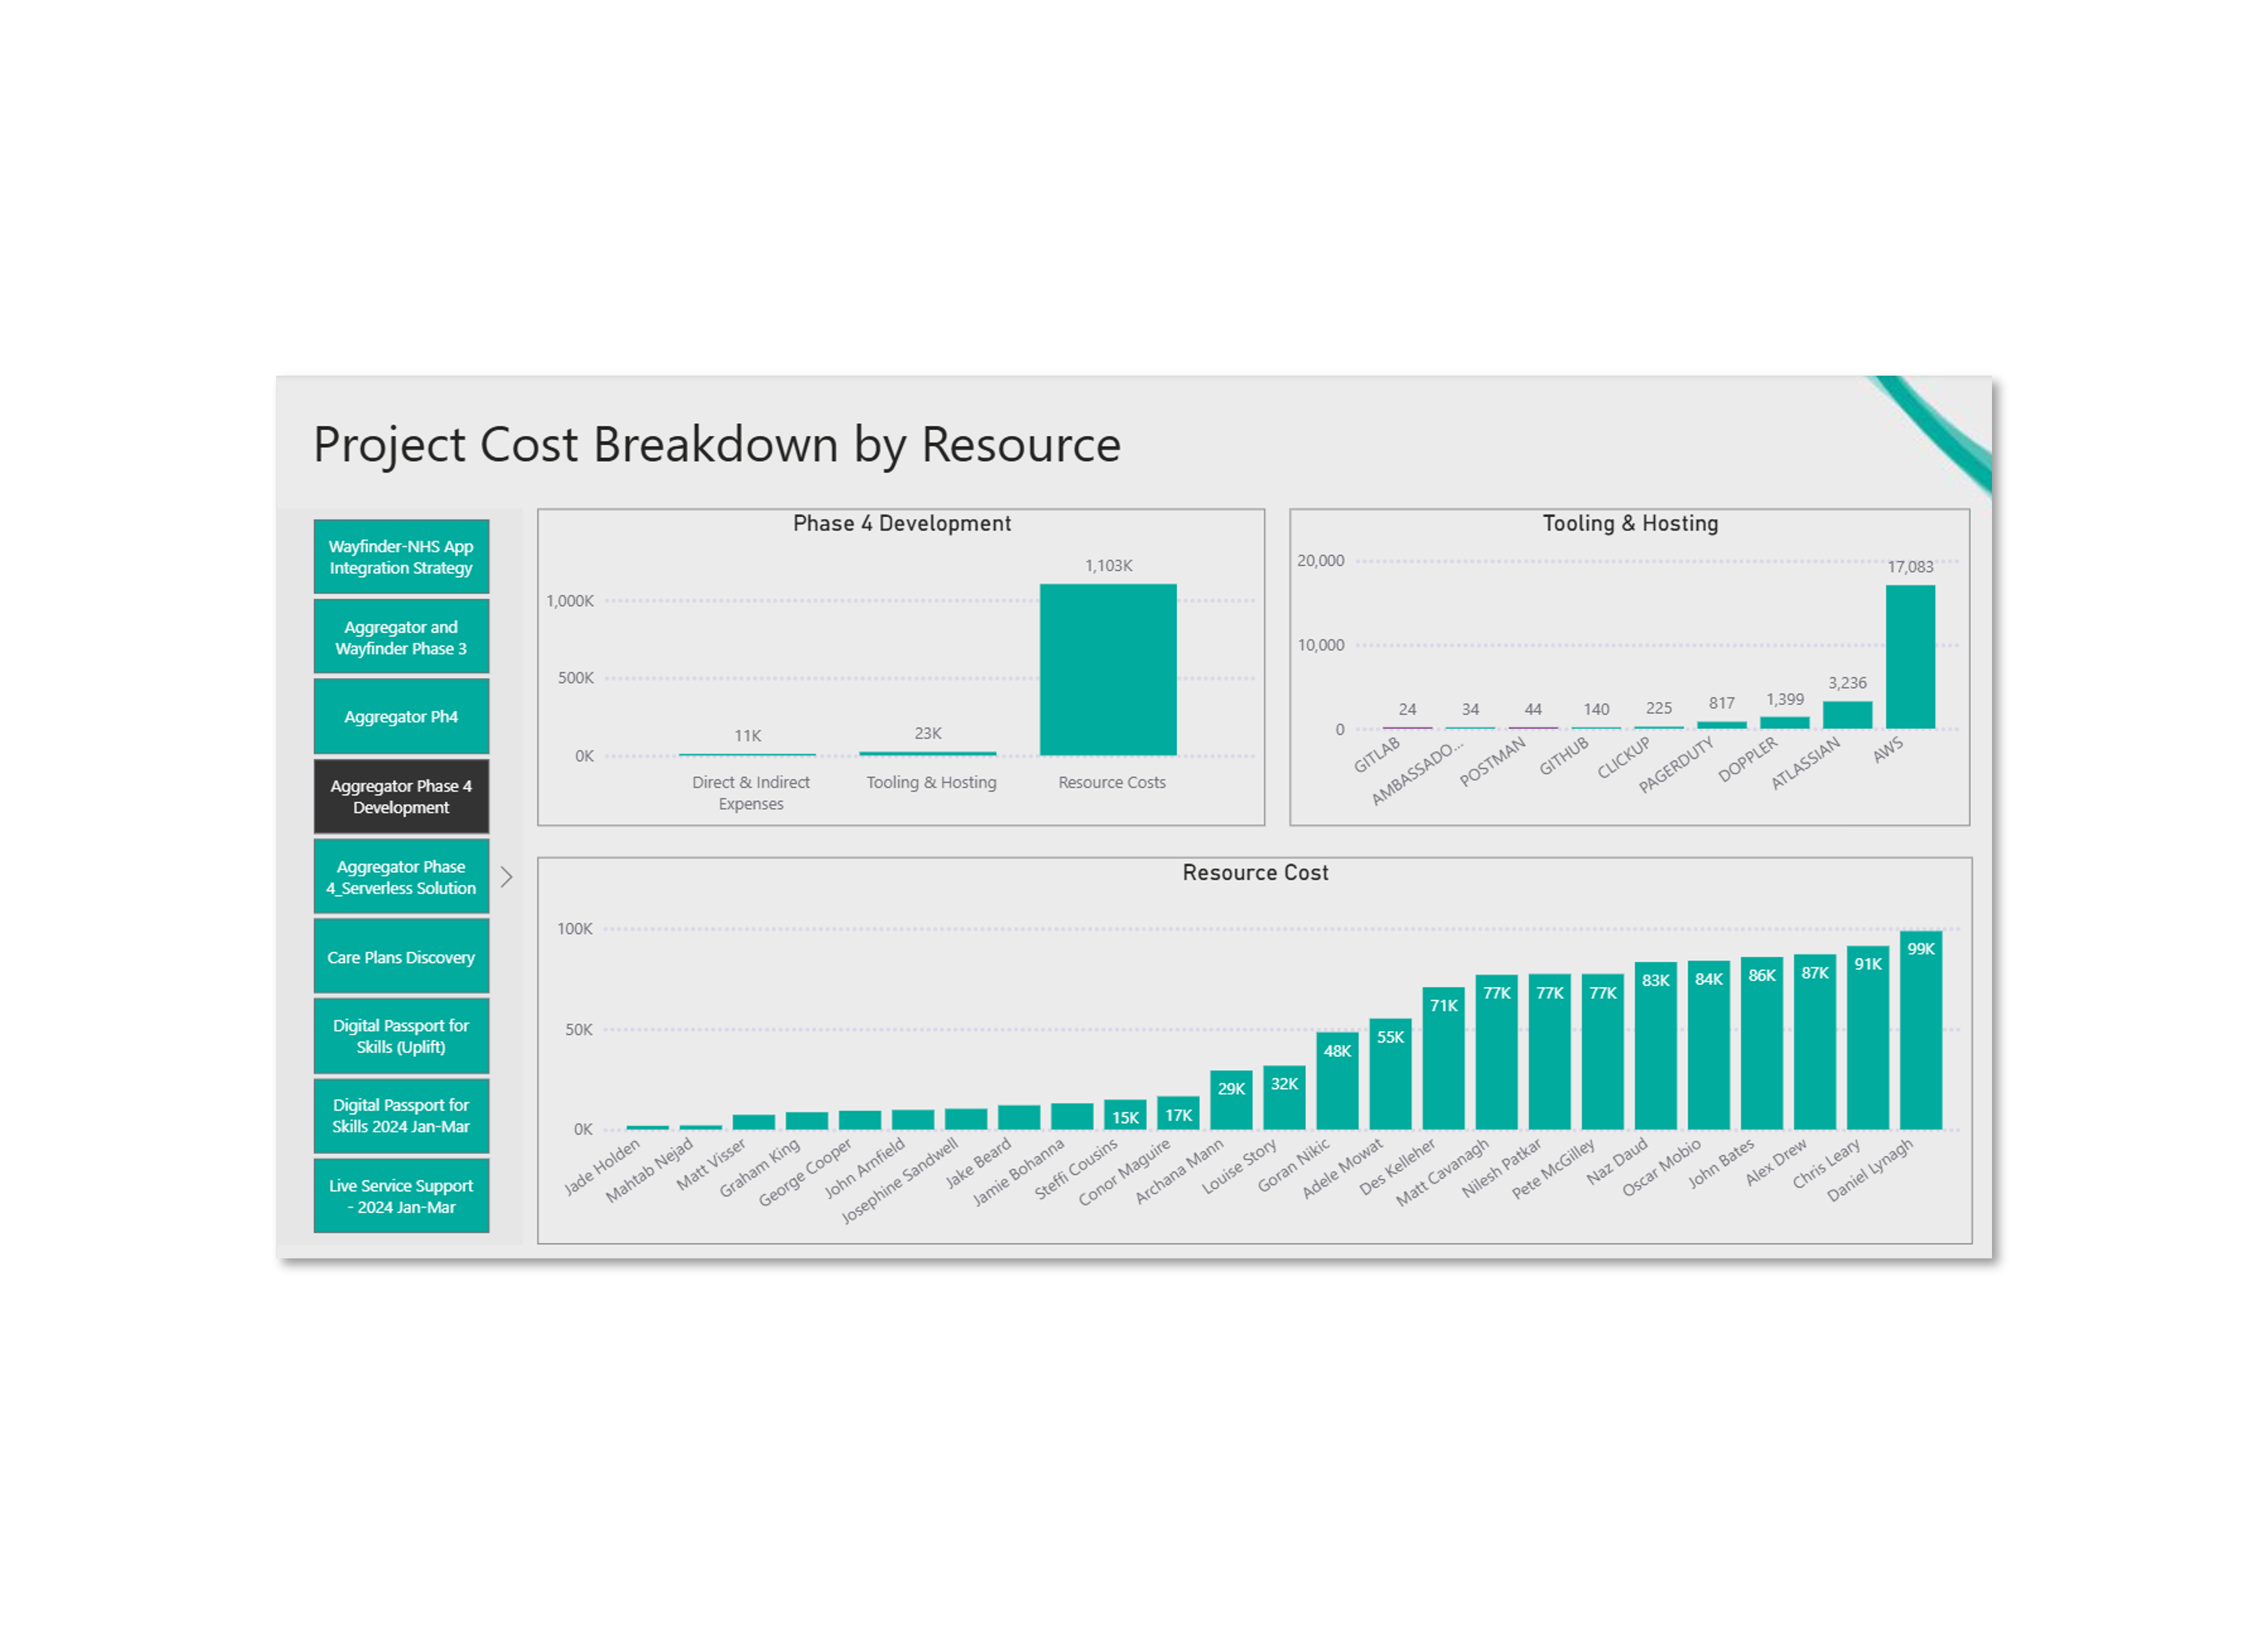
Project Cost Breakdown
Our professional services client required a suite of reports for board reporting, tuned to the orgnisations colour pallete, preapring board slides is o longer a tedious month end activity, instead, the saame consistently formatted reports are refreshed and ready to use in an instant.